
User Guide
The complete reference for the Tradelics desktop app — accounts and broker sync, trade details, metrics and analytics, filtering, reports, preferences, licensing, and every keyboard shortcut.
Table of Contents
- Getting Started
- Main Interface Overview
- Managing Accounts
- Broker Synchronization
- Trade Details
- Trades
- Import & Export
- Labels Manager
- Symbols / Pairs Manager
- Calendar View
- Metrics & Statistics
- Filtering Trades
- Reports
- Preferences
- Licensing & Activation
- Undo, Redo & Backups
- AI Assistant
- Keyboard Shortcuts
- Troubleshooting
1. Getting Started
1.1 System Requirements
| Component | Requirement |
|---|---|
| OS | Windows 10 or Windows 11 (64-bit). macOS and Linux support are planned. |
| Java | Bundled with the installer — no separate Java installation required. |
| Updates | Tradelics installs from the Microsoft Store, which also keeps it up to date — new versions usually arrive on their own within a day of release, with nothing to download and nothing to run. |
| Disk space | ~250 MB for the application. Journals grow with trade history and screenshots (the trade database itself is typically a few MB per year). |
| Internet | Required for license activation, live broker sync, and exchange rate lookups. The app works offline otherwise. |
1.2 First Launch & Licensing
When Tradelics starts for the first time, the License & Activation screen appears. You have two options:
- Start Free Trial — begins a full-featured trial. No credit card required. The remaining trial days are shown in the title bar.
- Enter License Key — paste your purchased key to activate immediately.
See Section 15 — Licensing & Activation for full details on activation, device transfers, and what happens when a trial expires.
1.3 Creating Your First Journal
Tradelics stores all your trading data in a journal. A journal is a self-contained folder holding your trade database (.tdls) together with everything that belongs to it, such as your trade screenshots. Because it is self-contained, you can back up or move a whole journal simply by copying its folder — and you can create as many journals as you like (one per year, one per strategy, one per broker).
- Go to File → New Journal (or press Ctrl+N).
- Choose a location and a name (e.g.,
MyTrades-2025). - Click Save. The new journal opens and is ready to use.
On first launch, a welcome screen offers the same choices — create a new journal, open an existing one, or jump back into a recent one. Whether the welcome screen appears on startup, and whether Tradelics reopens your last journal automatically, are both configurable in Preferences → Appearance.
Recently used journals are listed under File → Open Recent. Use File → Save Journal As… (Ctrl+Shift+S) to create a complete copy — journal and images — at any time. Tradelics also backs the journal up on its own while you work; see §16.2.
1.4 Setting Up Your First Account
Every trade belongs to an account, which represents a broker account and holds settings for currency, fees, and broker connectivity.
- Open the Accounts view: View → Accounts or press Ctrl+A.
- Click + Add Account.
- Fill in the Account Name (e.g., “FTMO Challenge 100K”, “Kraken Spot”, “IC Markets Live”).
- Enter your Initial Balance — the balance before your first trade.
- Select the account’s Currency (USD, EUR, GBP, etc.).
- Click OK.
1.5 Adding Your First Trades
There are three ways to get trades into Tradelics:
Option A — Live Broker Sync (Recommended)
Connect directly to your broker. Tradelics fetches your trade history automatically and stays up to date. Supports MT5, MT4, cTrader, Kraken, and NinjaTrader 8. See Section 4 for setup instructions.
Option B — Import a CSV File
Export your trade history from your broker platform as a CSV file, then import it via File → Import → Transactions (Ctrl+I). Tradelics auto-detects the format for most major brokers. See Section 7.
Option C — Manual Entry
Add trades one by one via Edit → Add Transaction (or Ctrl++). Useful for paper trading, backtesting records, or brokers without a CSV export.
For the fastest setup: try CSV import first, since your broker platform almost certainly has a trade history export. Live sync can be configured later once you’ve verified the data looks correct.
2. Main Interface Overview
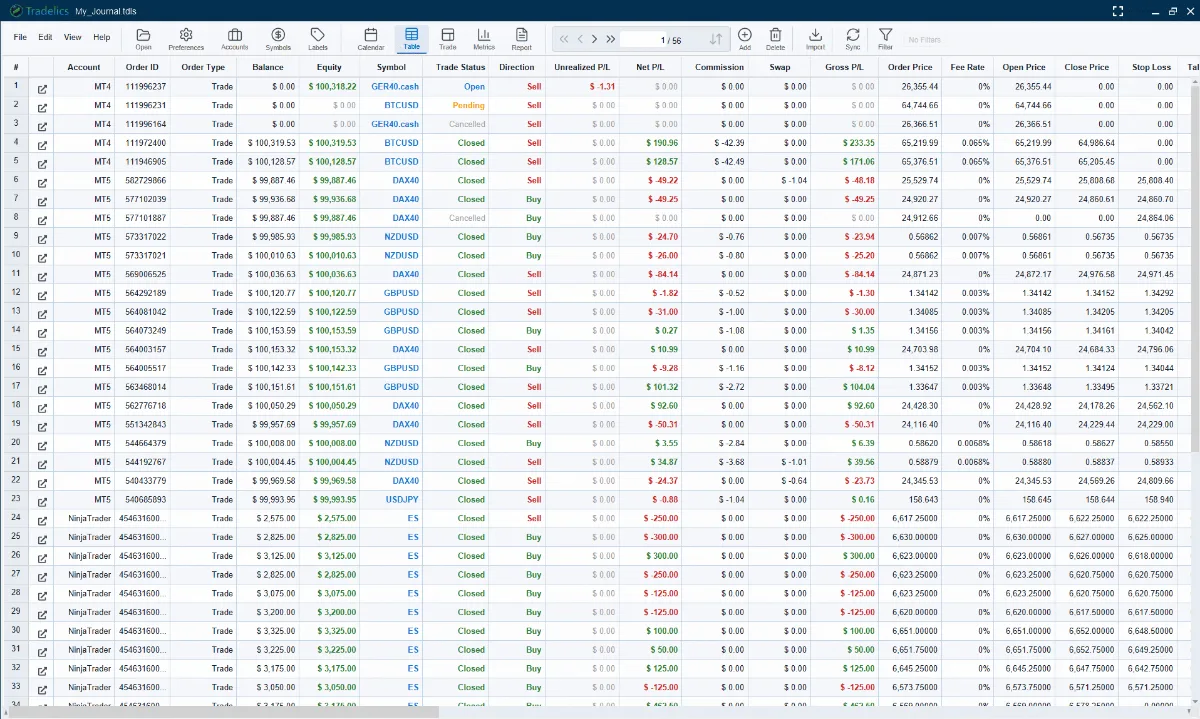
Opening a journal lands you on the Dashboard (part of the Metrics view, §11.1). It is built to answer both opening questions at once — how the account is doing, and what you most recently traded — so you can start from there and move to the Trades view when you want the full list. Every other view is one click or one shortcut away on the toolbar below.
Menu Bar
- File — Create, open, and close journals (including Open Recent), sync accounts, import/export, Restore from Backup…, repair, preferences, exit.
- Edit — Undo and redo your own changes (§16.1), add and delete transactions.
- View — Switch between views, open the Accounts / Labels / Symbols managers.
- Help — User Guide (you are here), About, Check for Updates, Contact Support, Keyboard Shortcuts.
Toolbar
The heart of the toolbar is the six view buttons — every main screen is one click (or one shortcut) away:
| Button | Shortcut | What it shows |
|---|---|---|
| Calendar | Ctrl+1 | Daily P&L grid — see your performance day by day |
| Trades | Ctrl+2 | Spreadsheet list of all trades with sortable columns |
| Trade Details | Ctrl+3 | Detailed single-trade editor with images, labels, and review |
| Metrics | Ctrl+4 | Charts, statistics, and performance analytics |
| Report | Ctrl+5 | A period’s trades day by day — today, this week, this month — with PDF and Word export |
| Filter | Ctrl+6 | Advanced filtering — affects all other views |
Around the view buttons you’ll also find, left to right: Open, Preferences, the three managers (Accounts, Symbols, Labels), navigation controls (First / Previous / Next / Last and Reset Sort, which act on the trade list), and the data actions Add, Delete, Import, and Sync. If you prefer a more compact toolbar, turn off the text labels in Preferences → Appearance — the icons remain, with tooltips.
Working with multiple accounts
All views show every account in the journal by default. To focus on a single account, use the Filter view (Ctrl+6) and add an account condition — the selection then applies to every view, including Metrics.
3. Managing Accounts
Open the Accounts manager at any time with Ctrl+A or View → Accounts. You can create as many accounts as you need; to view just one of them, add an account condition in the Filter view.
3.1 Creating an Account
Click + Add Account in the Accounts view. The Account Dialog has two sections side by side: Account Details on the left — which includes the fee settings — and Broker Connection (Optional) on the right. The left half answers what is this account; the right half answers where its trades come from.
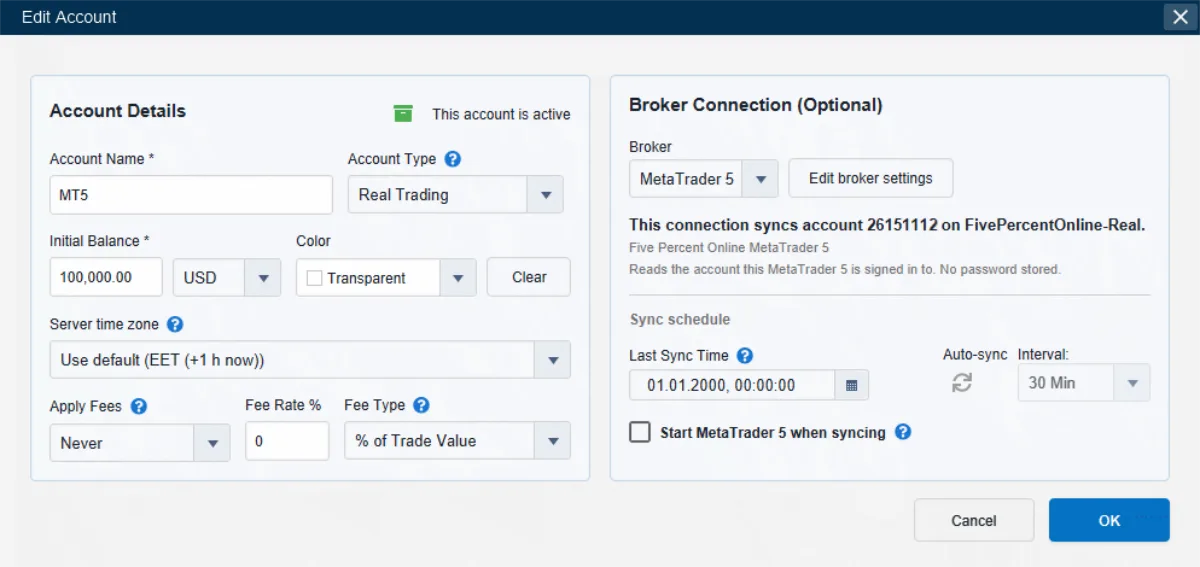
The dialog sizes itself to whatever the account actually needs: choosing a broker adds its connection summary and sync schedule on the right, and the window grows just enough to fit them. On a narrow screen the two sections stack into a single column instead, so nothing is ever cut off.
Accounts you no longer trade can be archived rather than deleted — a prop account the firm has closed, for instance. Use the archive button on the account’s row in the Accounts view (or in the Account Dialog), and the Show archived toggle to bring archived accounts back into sight. Archiving keeps the trade history intact while decluttering your day-to-day view.
An archived account is frozen. Until you unarchive it:
- it is never synced — not by auto-sync, Sync, Sync All or Fetch missing data — and Tradelics does not start its trading platform;
- its trades cannot be added to, edited or deleted, from Trade Details, the Trades table’s edit dialog or an import, and Ctrl+Z will not undo an older change to them;
- its trades open read-only in Trade Details, with a note saying why: you can read them and copy from them, but not change them;
- it is not offered as a destination when adding or importing trades, and its settings cannot be edited.
Its trades stay in your journal and your statistics, and its sync settings are kept as they were, so unarchiving it — the same button — puts everything back exactly as it was.
3.2 Where Net P/L Comes From
Some trades arrive with their profit already worked out, and some don’t. A trade synced from your broker, or imported from a platform export, carries the broker’s own settled figure — that figure is what your account actually paid you, so Tradelics keeps it exactly as reported. A trade you typed in yourself, or imported through a custom CSV mapping with no profit column, has no such figure, so Tradelics calculates one from your entry price, exit price, and position size.
This is decided per trade, not per account, because one account normally holds both kinds: a funded account you sync from, with a handful of backtested ideas journalled alongside the real ones. You do not configure it anywhere.
The icon beside Net P/L
Open any trade and you will see a small icon next to the Net P/L field. It tells you where that number came from, and lets you change your mind.
| Icon | What it means | Clicking it |
|---|---|---|
| Calculator | Tradelics worked this figure out, because nothing supplied one. | Lets you type your own figure instead. |
| Closed padlock | Your broker supplied this figure, and it is shown exactly as reported. | Unlocks the field so you can correct it. |
| Open padlock | You took this figure over by hand. | Hands it back — the original figure returns and what you typed is discarded. |
A correction you make by hand survives the next sync. Tradelics records that the figure is yours, so a later sync of the same trade will not quietly overwrite it. Hand it back with the open padlock whenever you want the broker’s number again.
Net P/L and Gross P/L stay consistent with each other while you edit: change either one and the other follows, so that net always equals gross minus commission and swap.
Account Type
The account type no longer decides any of this. Earlier versions asked you to label an account Real or Test, and that label decided whether profits were calculated for every trade in it. Accounts labelled Test have been converted to ordinary trading accounts, and the trades inside them keep the profit figures they already had — nothing was recalculated.
3.3 Account Fields Explained
| Field | Description |
|---|---|
| Account Name | A descriptive name shown throughout the app. Examples: “FTMO Challenge 100K EUR”, “Kraken Spot”, “IC Markets Live USD”. Renaming reaches every trade in the account — see below. |
| Initial Balance | Your starting balance before any trades were placed. Used to calculate your equity curve, drawdown, and running balance. For funded accounts, this is the challenge starting capital. Changing it moves every running balance in the account — see below. |
| Currency | The account’s native currency (USD, EUR, GBP, etc.). When your journal contains only this currency, all P&L is displayed in it; when accounts in different currencies are analyzed together, aggregated figures are shown in the base currency set in Preferences → Metrics → Base Currency (see §3.5). The balance column always stays in native currency and is never converted. |
| Color | A visual identifier for this account in charts and multi-account views. Pick a unique color per account. |
| Server time zone | The time zone this account’s broker runs its trade server on — see below. |
Two fields that reach further than themselves
Most account fields affect the account. Two of them rewrite its trades, so Tradelics asks before saving rather than afterwards — the dialog is still open on the values that caused the question, which is where you need to be if you change your mind. Changing both at once asks once.
| Change | What it reaches |
|---|---|
| Renaming the account | The new name is carried across every transaction that used the old one. This cannot be undone with Ctrl+Z — a rewrite of every row is deliberately kept out of the undo history, because recording it would bury your own edits under one entry per trade. The way back is to rename it again. |
| Changing the opening balance | The opening balance is the first term of every running balance in the account, so moving it moves every figure after it, and the current balance, by the same amount. The confirmation names that amount. Tradelics then re-walks the whole account, so the balance column, equity curve and drawdown agree with the new figure straight away. |
Neither question is asked when there is nothing to reach: a brand-new account, or one that holds no transactions yet, saves without interruption.
Server time zone
Brokers stamp trades in their own server’s time, which is almost never yours. Tradelics converts each trade from that zone to your computer’s time zone, using the zone’s rules on the day of the trade — so a trade from January and one from July are each shifted by the right amount, across daylight-saving changes on either side.
The conversion happens once, as the trade is synced or imported, and the converted time is what gets stored. Changing this setting afterwards therefore affects only trades imported from then on — it does not go back and re-time the trades already in your journal. If times are already wrong, correct the zone and then re-import (or re-sync) the affected period.
It sits in Account Details, next to the currency, and it is set per account — not per broker connection. An account maps to one broker, and the zone describes that broker whether or not you ever configure live sync: an account you only ever feed with CSV files needs it just as much as a synced one. Two prop firms can sit in different zones, and a single application-wide value could not be right for both.
| Value | Effect |
|---|---|
| Use default | Follows Preferences → Sync/Import → Server time zone. This is the starting value, and for most people it is the right one — nearly every forex server runs on EET/EEST, which is what the default is set to. |
| A specific zone | Overrides the default for this account only. Use it when one of your brokers is on a different clock from the rest. |
The figure in brackets — Use default (EET (+1 h now)) — is how far ahead that zone is of your computer at this moment. It is a reading, not the setting, and it changes twice a year on its own.
If imported or synced trades land at the wrong time of day, this is the setting to check first — before importing a large history. It applies to MetaTrader 4 and MetaTrader 5 alike, and to CSV imports, because the zone belongs to the broker’s server rather than to the platform or file reading it.
3.4 Fee Configuration
The fee settings inside the Account Details section let Tradelics calculate a commission for you instead of you typing one on every trade. Three fields work together:
| Field | Description |
|---|---|
| Apply Fees | When the calculated fee is applied: Never, Import/Sync Only, Manual Only, or Always. With Manual Only, fees are added to trades you enter by hand while synced trades keep whatever the broker reported; Import/Sync Only and Always make Tradelics compute and apply fees to imported and synced trades too. |
| Fee Rate % | The rate used in the calculation. |
| Fee Type | What the rate applies to: % of Trade Value, Per Contract, or Per Order. |
All P&L metrics in Tradelics are net of fees (commission + swap deducted). This is intentional — trading performance should always be measured after costs.
3.5 Multiple Accounts & Multi-Currency
You can have any number of accounts in a single journal, and by default every view aggregates trades and metrics across all of them.
When those accounts use different currencies (say, a USD futures account and a EUR forex account), Tradelics converts P&L figures to a single base currency so the numbers can be compared and summed. The base currency is set in Preferences → Metrics → Base Currency. Conversion kicks in only when the trades being analyzed actually span more than one account currency, and it applies everywhere statistics are computed — Metrics, the Calendar, and every breakdown page — not just one view.
Exchange rates come from ECB / IMF data, are cached locally, and are resolved at each trade’s close date (looking back up to seven days to cover weekends and holidays). If a rate can’t be found for a trade, that trade is flagged and a warning banner tells you the converted metrics are incomplete. The raw account balance always remains in the account’s native currency.
4. Broker Synchronization
Live sync lets Tradelics pull your trade history directly from your broker — no CSV exports required. New trades appear automatically, and closed positions are updated in real time.
Tradelics only ever reads
Tradelics never places, modifies or closes a trade. It does not send orders, it does not change stop-loss or take-profit levels, and it does not move money. Every broker connection is used in one direction only: to read what has already happened in your account.
This is a property of what the software does, not a setting you have to find — there is no order-placing code in Tradelics to switch on. Where a broker lets you hand over reduced permissions, take it anyway: it costs you nothing here and limits the damage if the credential ever leaks elsewhere.
| Broker | What to hand over |
|---|---|
| MetaTrader 5 | Usually nothing — Tradelics reads the session your terminal already has open. If you do use the password route, the investor (read-only) password is enough, and it cannot trade even in principle. |
| MetaTrader 4 | Nothing. Tradelics reads a CSV the export script writes. |
| Kraken | An API key with query permissions only. Never grant trading or withdrawal rights. |
| NinjaTrader 8 | Nothing. Tradelics reads NinjaTrader’s local database. |
4.1 How Sync Works
Different brokers use different connection methods:
| Broker | Connection Method |
|---|---|
| MetaTrader 5 (MT5) | Tradelics Bridge — a small local service that communicates with MT5 over HTTPS on localhost. |
| MetaTrader 4 (MT4) | Export files — a setup wizard installs two small MQL4 files into your terminal; they write your history to a CSV that Tradelics picks up automatically. Supports auto-sync (see §4.3). |
| Kraken | Direct REST API — Tradelics connects directly to Kraken’s servers using your API key. |
| NinjaTrader 8 | Direct database read — Tradelics reads NinjaTrader 8’s local trade database directly. No plugins or exports needed. |
| cTrader | Direct cloud API — you authorize Tradelics once in your browser and it reads your account from cTrader’s servers. No bridge, no platform running, no files. |
Binance appears in the broker list but is a placeholder — live Binance sync is not implemented yet (use CSV import instead).
cTrader needs an internet connection. MetaTrader 4, MetaTrader 5 and NinjaTrader all sync from something on your own machine and keep working offline. cTrader is a cloud service, so its sync — and only its sync — needs to reach cTrader’s servers. Everything already in your journal stays readable offline.
Credentials are encrypted at rest using your operating system’s secure storage (Windows: DPAPI, macOS: Keychain). They are never transmitted in plain text. MetaTrader 5 usually needs no password at all — see §4.2.
Fetch missing data
Each connected account in the Accounts list has a small history-icon button alongside Edit and Archive. Regular syncs only ask for what changed since the last one, which is fast but can leave gaps — a trade the first sync missed, or MAE/MFE values that could not be calculated at the time (see §11.4 and the note on MetaTrader’s history window below). Fetch missing data re-asks the broker for that account’s entire history and fills in anything missing.
This is additive only. Your journal is not rewritten: comments, screenshots, tags, strategies, ratings and any hand edits stay exactly as they are, and an existing trade can only gain values it was missing — nothing is overwritten or removed. Because it re-reads the whole history, it takes minutes rather than the few seconds a normal sync takes.
Stops, targets and plans
A trade carries three stop losses, and a sync fills each one from a different record (the fields are described in §5.2):
- Stop Loss / Take Profit — where the levels are now. For an open position they follow your broker on every sync, so a stop you move in the platform shows up here. A value typed into this field on an open, synced position is replaced by the broker’s on the next sync, whenever the broker reports a level.
- Initial SL / Initial TP — the levels the trade was entered with. R-multiples are measured from these.
- Planned SL / Planned TP — what you intended. A sync fills these only from an order that was still waiting to be filled when Tradelics saw it, and only if you have not set them yourself. A filled position’s levels say what happened, not what you planned, so trades that were never seen as a pending order have no plan unless you enter one — and Planned RRR shows — for them rather than a made-up figure.
How the entry levels arrive depends on what each platform keeps:
| Broker | Initial SL / TP |
|---|---|
| MetaTrader 5 | Read from the order that opened the position — exact, even if you moved the stop later. A trade that closed on its stop or target also gets the level it closed at, including on history Tradelics never watched. |
| cTrader | Read from cTrader’s order history — exact. |
| NinjaTrader 8 | Read from NinjaTrader’s record of each order’s first price — exact. |
| MetaTrader 4 | Recorded by the export Expert Advisor when it sees the trade open — exact for trades opened while it was running. MT4 keeps no order history, so older trades get a worked-out value. |
| Kraken, CSV imports, manual trades | Worked out from the planned stop, or the current one. |
A worked-out level is marked with a small ? beside the field in Trade Details. It is usually right and is enough to calculate R, but Tradelics will not tell you that you moved a stop on the strength of a guess. Type the real value in and the mark goes away.
Price history
MetaTrader 5 and MetaTrader 4 syncs also store the one-minute price bars around each trade, for trade charts in a future version. This happens now because brokers stop serving minute history after a while, so bars not stored today often cannot be fetched later. MetaTrader 5 fetches them in the background after a sync, with a small progress notice; the MetaTrader 4 Expert Advisor writes them to files beside its export. Nothing is collected for other brokers. What is stored, how much space it takes and how to delete it are in Preferences → Charts (§14).
4.2 MetaTrader 5 (MT5)
MT5 sync uses the Tradelics Bridge, which is installed alongside Tradelics and starts automatically when Tradelics opens — there is nothing to set up for the bridge itself.
In most cases Tradelics does not need your MT5 password. If your MetaTrader 5 is already signed in to the account you want to journal — which is how a prop-firm terminal normally arrives — Tradelics simply reads that open session. Nothing to type, nothing stored.
Setting up a connection
- Open Accounts (Ctrl+A), select your account, and click Edit (or create a new account).
- In the Broker Connection section, select MetaTrader 5 as the broker type. The MetaTrader 5 setup opens automatically.
- Choose your installation. Tradelics lists the MetaTrader 5 installations it found on your computer, by folder name — for example FTMO Global Markets MT5 Terminal. Pick the one this account trades through, or click Browse… and select its
terminal64.exeif it isn’t listed. - Confirm the account. Press Continue: Tradelics opens that installation and reads which account it is signed in to, then shows you the login, server and broker. If it is the right one, click Link this account — setup is done.
- Click OK, then Sync (Ctrl+S) or the sync button in the toolbar. The first sync fetches everything the broker still holds for that account.
Afterwards the Broker Connection section shows a short summary — the linked account, the installation it uses, and how it connects. To change any of it, click Edit broker settings beside the broker dropdown and the setup reopens on your current installation.
That button is the way back into the wizard at any time. It reads Set up MetaTrader 5 until a terminal is linked and Edit broker settings afterwards, so its label tells you which state the connection is in. If you cancelled the wizard when it opened by itself, this is how you reopen it.
Subsequent syncs only fetch what is new or has changed since the last one, which is what keeps them fast.
How far back the first sync reaches
Back to the account’s first trade, in practice — not to whatever period your History tab happens to be showing. That selector is a display filter on the terminal window; it does not limit what Tradelics can ask for. On a demo account with History set to Last month, the first sync still returned 1,737 deals going back more than two years.
This is worth knowing because it is not how every journal works: several import only what the local terminal is currently holding, so a fresh terminal install, or one whose history has been trimmed, quietly gives them a shorter record. Tradelics asks the broker rather than the window.
The limit is whatever your broker still keeps. Prop firms and brokers do retire old account data, and a terminal that has never been signed in to the account has nothing cached to fall back on — if you need trades older than your broker retains, import them from a statement instead (§7).
Why the installation matters
Prop firms each ship their own branded MetaTrader 5, so several installations can be open at once. Without being told which one to use, the bridge attaches to whichever terminal it happens to reach — with two open, that is a coin flip. Choosing the installation is what makes a sync land on the right account, which is why it is the first thing the setup asks and why it cannot be skipped.
Look for terminal64.exe when browsing. MetaTrader 4 uses the name terminal.exe, and the two cannot be told apart by name alone — Tradelics only offers terminal64.exe automatically, and warns you if a browsed terminal.exe looks like an MT4 installation.
When Tradelics does need a password
Reading the open session only works for the account the terminal is already signed in to. Use the password route when that isn’t what you want — for example the installation is signed in to a different account, or you want Tradelics to sign in by itself. On the confirmation step, tick Set credentials — the forward button changes from Link this account to Continue with credentials — then enter the Server, Login and Password for the account you want. The server is pre-filled from what the terminal reported, which is usually already correct.
A connection with credentials will sign the terminal out of whatever account is open in order to reach its own, and Tradelics cannot sign that one back in afterwards — it does not hold its password. If both accounts matter to you, give each one its own MetaTrader 5 installation instead.
If your broker issues an investor password, use that one rather than your master password. It signs in read-only, which is all a sync needs, and it cannot place or close a trade even if it is exposed. Most prop firms hand you one alongside the master password without being asked.
Passwords are only stored when you choose this route, and they are encrypted at rest using your operating system’s secure storage. A connection that reads the open session has nothing to encrypt.
Per-connection sync settings
Under Sync schedule, an MT5 connection carries one setting of its own beyond the auto-sync toggle and interval:
| Setting | What it does |
|---|---|
| Start MetaTrader 5 when syncing | MT5 has to be running for a sync to succeed. Tick this and Tradelics launches this account’s installation itself when it is closed. Leave it off to start MetaTrader 5 yourself — the sync then tells you it is not running instead of launching it. |
It is per connection, because each one has its own terminal. There is no application-wide auto-start setting.
The Server time zone is not here — it lives in the Account Details section on the left, because it describes the broker whose trades the account holds whether or not a connection is ever set up. See §3.3.
Cancelled orders
Orders you cancelled in MetaTrader 5 — and ones that expired or were rejected — are not imported by default. To review the setups you walked away from, set Orders cancelled at the broker to Import them in Preferences → Sync/Import. They arrive with the status Cancelled, keep the stop and target they were placed with as their plan, and are counted in no statistic. Switching it on reaches only as far back as your broker’s own order history; switching it off stops new ones arriving and keeps the ones you already have, with their notes, tags and images.
Two accounts, one MT5 installation
If two of your accounts sign in through the same installation, syncing one of them means signing the other out first.
A connection that reads the open session never switches — with no password it could not sign back in, so instead of offering a switch it cannot complete, the sync stops and tells you to open that account in the terminal.
A connection that holds credentials can switch, and what happens is governed by the MT5 account-switch policy in Preferences → Sync/Import: Ask me first, Switch without asking, or Never switch. Automatic background sync silently skips an account that would require a switch unless the policy is Switch without asking — it has nobody to ask, and ending a live session unattended is not a decision to make on a timer.
The reliable answer to this situation is one MetaTrader 5 installation per account. Prop firms hand you a branded terminal precisely so each account has its own; separate installations mean no switching, no passwords, and no interrupted sessions.
MetaTrader isn’t keeping enough history for MAE/MFE
MAE/MFE (see §11.4) is reconstructed from MetaTrader’s own 1-minute chart history, and MetaTrader’s default Max bars in chart setting keeps only about 100,000 M1 bars — roughly 14 trading weeks. Trades older than that have no minute data for Tradelics to reconstruct excursions from, so they can never get MAE/MFE no matter how the sync window is set. Tradelics detects this and tells you, once per account, rather than leaving the gap unexplained.
To fix it: in MetaTrader, open Tools → Options → Charts and raise Max bars in chart (Unlimited is fine), then restart the terminal. This protects new trades going forward, and also recovers old ones — once MetaTrader has re-downloaded its history, set the account’s Last Synchronized date back and run Fetch missing data (above) to backfill them.
4.3 MetaTrader 4 (MT4)
MT4 has no live API, so Tradelics puts a small file inside MT4 that writes your trade history out to a CSV, and reads that file — including automatically, on a schedule. The setup wizard installs both files for you and tells you what to do inside MT4 afterwards.
- In Tradelics: Accounts → Edit → Broker Connection, choose broker type MetaTrader 4, then click Set up MetaTrader 4 — the button beside the broker dropdown.
- Choose the terminal. The wizard lists the MetaTrader 4 installations it finds on this computer. If yours is not listed — a portable install, or one in an unusual place — use Browse and point it at
terminal.exeinside the MT4 folder. - Install. Tradelics copies
Tradelics_Export.mq4into that terminal’sMQL4\ScriptsandTradelics_AutoExport.mq4intoMQL4\Experts. - Do the three things inside MT4 that the wizard lists — it will not export until you have. They are: right-click the Navigator and choose Refresh (or restart MT4); drag Tradelics_AutoExport onto any chart; make sure AutoTrading is on.
- Pick the account. The last page lists the account numbers found in the exports on this computer. If the export has not run yet there will be nothing to list — finish the steps above, or type the number in by hand.
- Sync with Ctrl+S. Tradelics reads the exported CSV and imports the trades.
Once it is set up, the Broker Connection section states what it will do, naming the terminal it reads — “Reads account 1420743762 from FTMO Global Markets MT4 Terminal.” If it says Not set up yet, the wizard has not been completed and no sync will find anything.
As with MetaTrader 5, the button beside the broker dropdown changes with the state: it reads Set up MetaTrader 4 until the terminal is linked, then Edit broker settings. Click it whenever you need to re-run the wizard — after a Tradelics update, or to point the account at a different terminal.
There is nothing to configure inside MetaTrader 4. The Expert Advisor follows the sync interval you set for this account in Tradelics: change the interval and the export re-times itself within one interval, with no reattaching and no restart. To export immediately at any time, double-click Tradelics_Export under Scripts in the Navigator.
The export deliberately has no settings dialog. Some MetaTrader 4 builds crash while drawing that dialog for an attached Expert Advisor — the terminal closes outright — so the export gives MT4 nothing to draw. If attaching it used to crash your terminal, it will not any more.
What MT4 gives you
Closed trades, open positions, pending orders and deposits or withdrawals, with prices, times, commission, swap and profit — plus two figures MT4 does not record itself:
- Account equity on open positions: balance plus all floating profit and loss, read at the moment the export ran.
- MAE, MFE and ETD — how far a trade went against you and in your favour before it closed. MT4 keeps no record of what happened between entry and exit, so the export reconstructs it from the terminal’s one-minute bars.
Reconstruction has two consequences worth knowing. It is accurate to the minute, not the tick — a spike still registers, because it is inside the minute’s high and low, but not exactly when within that minute it happened. And it needs the one-minute history to be present: MT4 downloads that on demand, so a symbol you have never charted may have none, and trades older than the downloaded history have none either. Where it is missing, MAE and MFE are left blank rather than filled with zero — a zero would read as “this trade never went against me”, which is a claim about the trade rather than an admission that the data is absent.
After a Tradelics update, re-install the export files. They live inside MT4 and are not updated when Tradelics is. Tradelics checks which version wrote the export: after a manual sync it tells you when your copy is out of date and offers to re-install it in one click, and if the copy is too old to read at all, the sync stops and offers the same. A running EA keeps using the copy it was compiled from, so after re-installing, remove Tradelics_AutoExport from the chart and drag it on again, or it will go on producing the old format.
The current export also records two things MT4 itself forgets: the stop and target each trade was entered with, noted when the EA first sees the trade open (see §4.1), and the one-minute price bars around your recent trades, written to a Candles folder beside the export for future trade charts. Both only work while the EA is running, so trades opened before it was attached keep a worked-out entry stop. The bar files are listed in Preferences → Charts, where you can delete them.
If the files cannot be written — MT4 is open, or installed somewhere protected — use Save files… in the wizard and copy them in yourself: Tradelics_Export.mq4 into MQL4\Scripts, Tradelics_AutoExport.mq4 into MQL4\Experts, under File → Open Data Folder in MT4.
Per-connection sync settings
Under Sync schedule, an MT4 connection carries one setting of its own beyond the auto-sync toggle and interval:
| Setting | What it does |
|---|---|
| Start MetaTrader 4 when syncing | When this account syncs and its MetaTrader 4 is closed, Tradelics starts it and waits for the export to be rewritten before reading. Leave it off to open MetaTrader 4 yourself. |
A closed terminal means no sync, not a silent one. MetaTrader 4 syncs by reading a file its export writes, so a closed terminal has nothing new to give — reading it again would just re-import what you already have. Tradelics refuses the sync and says so, rather than reporting success on data that has not moved. This also covers a terminal that is running but not exporting: sitting at a login prompt, or with no Expert Advisor attached to a chart.
If your MT4 timestamps look shifted, set the Server time zone in the account’s Account Details section (see §3.3). The zone belongs to the broker’s trade server rather than to the platform reading it, so the same setting covers MetaTrader 4, MetaTrader 5 and CSV imports alike.
4.4 cTrader
cTrader connects straight to cTrader’s own servers. There is nothing to install, no bridge to run, and the cTrader platform does not need to be open — Tradelics can sync while your computer is the only thing switched on.
You never enter a password or an API key. You sign in on cTrader’s own page, approve Tradelics once, and that is the whole setup.
- In Tradelics: Accounts → Edit → Broker Connection → cTrader.
- Click Authorize with cTrader. Your browser opens on cTrader’s sign-in page.
- Sign in and approve the request. Tradelics asks for read-only access to your account information — it cannot place, modify or close trades, and never asks to.
- Return to Tradelics. It lists the trading accounts that sign-in gave it access to, each showing the broker, login, currency and whether it is live or demo. Pick the one to journal.
- Confirm, and choose whether to reconstruct MAE/MFE excursions (see below). Click Finish.
Sign in with the cTrader ID that holds the account. cTrader only shows Tradelics the accounts belonging to the cTrader ID you signed in with. Some brokers — prop firms especially — create a separate cTrader ID for your funded account. If the account you were expecting is not in the list, that is almost always why: sign out of cTrader in your browser, then authorize again with the other ID. An account under a different cTrader ID needs its own connection in Tradelics.
MAE/MFE excursions
cTrader does not report how far a trade moved in your favour or against you before it closed, so Tradelics reconstructs it from minute-by-minute price history. That takes extra requests, which is why it is a choice rather than automatic. You can switch it off, or back on, any time through Edit broker settings.
The reconstruction runs on every sync, including the first, and it catches up on itself: each sync also revisits a batch of closed trades that still have no excursion figures, so trades missed while the option was switched off — or while a long sync was cancelled — fill in over the syncs that follow rather than staying blank forever. Once an account is up to date this costs nothing, because only trades still missing the figures are ever looked at.
Where minute history does not cover a trade, MAE and MFE are left blank rather than zero — zero would claim the price never moved against you, which is a specific and flattering thing to say about a trade nobody measured.
When sync stops working
A cTrader connection can go stale on its own, which no other broker in Tradelics does. The account dialog shows the current state next to the connection, and both cases are fixed the same way — click Edit broker settings and authorize again. Your account, trades and settings are kept; only the sign-in is renewed.
| What you see | What happened |
|---|---|
| Signed in — connected until date | Normal. Tradelics renews this by itself well before it runs out. |
| Sign-in has expired | The connection went unused long enough to lapse. Authorize again. |
| Access was revoked | Tradelics’ access was withdrawn from your cTrader account settings, on cTrader’s side. Authorize again to restore it. |
You can withdraw Tradelics’ access at any time from your cTrader account settings, under the section listing connected applications. Sync stops immediately; nothing already in your journal is affected.
Prefer not to connect at all? cTrader users remain fully supported through CSV: export your trade history from the cTrader platform and import it via File → Import → Transactions. The cTrader CSV format is auto-detected (see §7.2).
4.5 Kraken
Kraken uses a direct REST API connection — no bridge required.
- Log in to your Kraken account and go to Settings → API → Create New Key.
- Grant the key these permissions: Query Funds and Query Closed Orders & Trades (optionally also Query Open Orders & Transactions). No withdrawal or trading permissions are needed or recommended.
- In Tradelics: Accounts → Edit → Broker Connection → Kraken.
- Enter your Kraken API Key and Private Key (Secret), then click OK.
- Sync with Ctrl+S.
Never grant Withdrawal or Trading permissions to Tradelics API keys. Read-only permissions are sufficient and much safer.
4.6 NinjaTrader 8
NinjaTrader 8 is the simplest broker to connect: Tradelics reads NinjaTrader’s local trade database directly. No plugins, no add-ons, no exports.
- In Tradelics: Accounts → Edit → Broker Connection → NinjaTrader 8.
- Tradelics auto-detects the NinjaTrader database at its standard location (
Documents\NinjaTrader 8\db\NinjaTrader.sqlite). If yours lives elsewhere, tick Use custom location and browse to it. - Pick which NinjaTrader account to sync from the account dropdown, then click OK.
- Sync with Ctrl+S.
Futures trades keep their contract month (for example ES December 2026) in a Contract Month field, while the symbol stays the root (ES) so your statistics still group all ES trades together. The NinjaTrader CSV import fills it too, and a sync adds it to trades you already have.
4.7 Auto-Sync
Tradelics can sync automatically in the background at a configurable interval. Auto-sync is configured per broker connection, in the account’s Broker Connection section — not in Preferences — so each account can have its own rhythm.
- Auto-sync toggle: turns background syncing on or off for this connection.
- Interval: 1, 5, 10, 15, 20, or 30 minutes, or 1 hour. The default is 30 minutes.
- Last Sync Time: a date-time picker showing where the last sync left off. Set it back to an earlier point to re-fetch history from that moment.
MetaTrader connections add one more setting here — Start MetaTrader 5 when syncing (see §4.2) or Start MetaTrader 4 when syncing (see §4.3). Both platforms need to be running for a sync to produce current data, and both settings let Tradelics open the terminal itself rather than refusing. The account’s Server time zone is not part of the sync schedule; it is an Account Details field, covered in §3.3.
Auto-sync doesn’t interrupt your work or change the current view. If you’d like a heads-up when it finds something, enable Auto-sync Notifications in Preferences → Sync/Import — a small toast then reports how many trades were added or updated; leave it off and auto-sync runs completely silently.
A background sync leaves what you are doing alone. It keeps Trade Details on the trade you were reading — matched by trade, not by row position, so a sync that inserts rows above it does not shuffle you somewhere else — and it never redraws over an edit you are part-way through. If the sync changes the same trade while you are editing it, both sets of changes are kept when you navigate away: your typing, plus whatever the broker reported. Where the two touch the same field the broker’s value wins, because that is what actually happened.
The same notification also tells you when auto-sync stops working — a broker rejecting the connection, a terminal that is closed, a network that is down. Because auto-sync runs on a timer, the warning appears when syncing goes from working to failing rather than on every attempt, and clears itself once a sync succeeds again. A repeat every minute would only teach you to dismiss it unread.
If you would rather auto-sync never spoke up, leaving Auto-sync Notifications off silences the failure warning too. Worth knowing before you turn it off: a failing auto-sync looks exactly like a quiet trading day.
Use a short interval (5–15 minutes) for active trading sessions. For end-of-day journaling, the default 30 minutes — or 1 hour — is plenty. Every sync is a real request to your broker, so reserve 1 minute for an account you are actively trading rather than leaving it on a journal you review at the end of the day.
5. Trade Details
Trade Details (Ctrl+3) shows one trade at a time in full detail. This is where you annotate trades, add screenshots, write notes, assign labels, complete trade reviews, and read Trade Mentor insights.
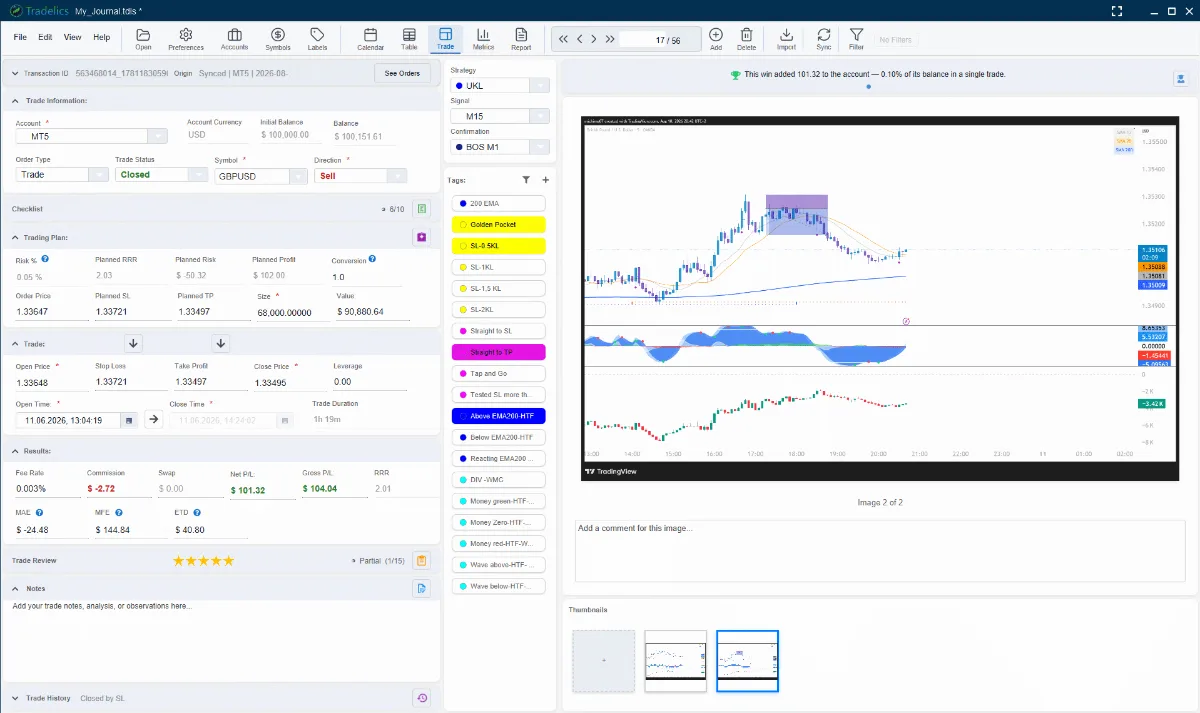
The three panels — Trade Form, Image Gallery, and Strategy & Labels — can be arranged in any order via Preferences → Appearance → Trade Details Layout.
5.1 Navigation
Navigate between trades using:
- Prev / Next arrows in the toolbar
- Ctrl+← (previous) and Ctrl+→ (next)
The sort order and active filter from the Trades view apply here too, so navigating means walking through exactly the same sequence of trades you see in the table — every one of them, however large the journal.
Every trade carries a Trade #, shown in the form header and available as a column, a filter field and a report field. It is given once and never changes or gets reused — not when trades are deleted, re-sorted or repaired — so “trade #412” always means the same trade.
5.2 Trade Fields Explained
| Field | Description |
|---|---|
| Symbol / Pair | The traded instrument (e.g., EURUSD, AAPL, BTCUSDT, ES). Drives price precision formatting via the Symbols manager tick size. |
| Direction | Long (buy) or Short (sell). |
| Entry Time | Date and time the trade was opened. |
| Exit Time | Date and time the trade was closed. Empty for open / pending trades. |
| Entry Price | The fill price at which the position was opened. |
| Exit Price | The fill price at which the position was closed. |
| Size | Position size, together with what it counts — lots, contracts, shares, coins or units — shown as a word beside the number. See §5.7. |
| Net P&L (Profit) | Net profit or loss after all fees have been deducted (commission + swap). The icon beside this field says whether the figure came from your broker or was calculated — see §3.2. |
| Commission | Broker commission charged for this trade. |
| Swap | Overnight holding cost (positive means you paid, negative means you received a credit). |
| Status / Trade Type | Planned, Pending, Open, Closed, Cancelled, Deposit, Withdrawal, etc. Determines whether the trade is counted in performance metrics — and what else the trade is allowed to carry, which is covered below. |
| Planned Stop Loss / Planned Take Profit | The levels you intended before the trade existed. Planned Risk and Planned RRR are built from them. You fill them in, or a sync does from an order it saw still waiting to be filled — never from a position that was already open or closed (see §4.1). |
| Initial SL / Initial TP | The levels the trade was actually entered with. R-multiples are measured from the Initial SL, so moving your stop afterwards — to breakeven, say — does not change a trade’s R. Each sits beside the current level it is meant to be compared with: equal means the level was never moved. Most brokers report these directly; where one does not, Tradelics works them out from the planned or current level and marks the field with a small ?. Type the real value in if you know it. |
| Stop Loss / Take Profit | Where the levels are now. On a synced open position they follow your broker. When a trade becomes Open or Closed, Tradelics copies the planned levels into these if they are still empty, so an entered position shows what it ran with; a level that is already there — one your broker reported, for instance — is never overwritten. |
| Planned Risk / Risk% | What the plan put at risk, in account currency and as a share of the account. |
| Planned RRR | What the trade was set up to make, in multiples of what it risked: entry-to-target distance divided by entry-to-stop distance, from the planned levels. It is a plan, so it ignores commission and swap — neither is charged until the position is entered. Shown as — when the trade has no plan. |
| RRR | What the trade actually made, in multiples of what it risked at entry: net profit divided by the distance from the fill to the Initial SL, times the size. Expect it to come in a little under the Planned RRR even on a trade that ran exactly to target — the profit is after commission and swap, and the plan is not. The two are not in disagreement; they answer different questions. |
| Comment / Notes | A full notes field for the trade — pre-trade rationale, post-trade reflection, or any observation. Beyond free-form text, it includes a notes editor with loadable, editable templates, so a recurring review structure doesn’t have to be retyped on every trade. |
Fields populated from broker sync (profit, commission, swap, entry/exit times and prices) are automatically filled and kept in sync. Fields like the planned levels and Labels are yours to fill in manually as part of your journaling practice.
Changing a trade’s status
A status is not a label — it is a claim about what happened, and some fields only make sense under some claims. A position you have just declared still running cannot also hold the price it closed at. So when a status change leaves part of the trade with nothing to describe, Tradelics asks first and names exactly what would go:
| Moving a trade— | gives up— |
|---|---|
| out of Closed (to Open, Pending, Planned, Cancelled) | its close time, duration, close price and profit. |
| to a status that was never filled (Planned, Pending, Cancelled) | its entry price, and the commission and swap that go with a fill. A broker never charges commission on an order that was not filled, so neither does Tradelics. |
The dialog lists only what that particular trade actually carries — it will not warn you about a commission you never had. Cancel and nothing happens at all.
- An entry price is moved, not lost. A position entered at market has no separate order price, so its fill price is the only entry it has; on the way back to an unfilled status it is put into Order Price rather than thrown away, and the planned figures keep working. An order price the trade already had is left alone.
- Your own figures are kept. Only a commission or a profit that Tradelics worked out is handed back. One you typed yourself stays where you put it.
- The stop loss and take profit are never cleared by a status change, planned pair or actual.
- Closing a trade by hand settles it. A trade you mark Closed — in the form, or in the Trades table where the P/L does not have to be calculated — drops its floating P&L and remaining volume, the same way a sync does when your broker closes a position.
- The values are journalled, so Ctrl+Z puts back what a status change gave up (§16.1).
This is the form asking, and only the form. An import or a broker sync sets a status without a dialog — a sync reporting a trade as closed is not something to second-guess.
5.3 Image Gallery
Attach trade screenshots directly to a trade — entry charts, exit setups, annotated price action, anything you want to reference later.
- Add images: Drag and drop image files onto the thumbnail strip (or a thumbnail), or click the upload button to browse.
- Multiple images per trade are supported, shown as a carousel you can step through.
- Images are stored inside your journal folder (in its
imagessubfolder), so backing up or moving the journal folder takes all your screenshots with it. - Paste a screenshot straight from the clipboard: right-click a thumbnail or the large image and choose Paste image from clipboard.
- The same right-click menu offers View full size, Copy path, Open folder and Delete. Hold Ctrl or Shift while clicking thumbnails to select several and delete them in one go (you are asked to confirm).
- Snapshots from TradingView, MetaTrader 4/5 or cTrader land here too, one picture per timeframe — see §5.8.
- Images appear in the Report view and, if you choose the appendix, in PDF and Word exports (§13).
Drawing on an image
Double-click the large image to open it in the image viewer. Its toolbar lets you mark up the chart with a pen, line, arrow, rectangle, ellipse and text (bold, italic and size; Enter confirms, Shift+Enter starts a new line), in any colour and line size. With the select tool you can pick a mark to move it, recolour it, delete it (Delete) or double-click a text to edit it. Undo and Clear all are there too; Save keeps the drawing, and closing with unsaved marks asks first.
Your markings are stored alongside the image, never burnt into it: the original screenshot file stays untouched, so you can change or remove a drawing at any time. The marks show on the carousel, the thumbnails and in reports.
5.4 Labels, Strategies & Tags
Labels let you categorize trades and then analyze performance by category in the Metrics view. There are four label types:
| Label Type | Purpose | Examples |
|---|---|---|
| Strategy | Your high-level trading methodology or approach. One per trade. | “Trend Following”, “Breakout”, “Mean Reversion”, “News Trading” |
| Signal | The specific pattern or trigger that caused the entry. One per trade. | “Pin Bar at Support”, “Double Top Breakout”, “MA Crossover”, “RSI Divergence” |
| Confirmation | An additional factor that validated the signal before entry. One per trade. | “Higher TF Alignment”, “Volume Spike”, “Key Level Confluence” |
| Tags | Flexible multi-purpose labels. Multiple per trade. | “Revenge Trade”, “Emotional”, “Perfect Setup”, “Missed Target”, “Over-leveraged” |
Labels are created and managed in the Labels Manager (§8). Once created, they appear as dropdowns in Trade Details.
The most powerful use of labels is in the Metrics view — you can see win rate, profit factor, and average P&L broken down by strategy, signal, or tag. This reveals which setups actually work in your trading.
5.5 Trade Review
The Trade Review is a questionnaire you fill out after each trade to track your psychology, discipline, and execution quality. Responses are stored with the trade and drive the Psychology Analytics in the Metrics view.
Click the Trade Review button in Trade Details to open the questionnaire dialog.
Trade Review questions are fully customizable — add, edit, remove, and reorder questions to match how you actually review your own trades. The default set documented below is what ships out of the box and is enabled from the start; treat it as a well-built starting point rather than a fixed list.
Default Questions (15, grouped by category)
Planning (4 questions)
- Did you follow your trading plan? (Yes / No)
- Was this trade based on a clear setup? (Yes / No)
- How confident were you before entering? (1–5 scale)
- How would you rate this trade’s setup quality? (1–5 scale)
Execution (3 questions)
- How well did you execute your entry? (1–5 scale)
- How well did you execute your exit? (1–5 scale)
- Did you move your stop loss? (No / Yes–Tightened / Yes–Widened / N/A)
Psychology (3 questions)
- What was your primary emotion? (Calm, Fear, Greed, FOMO, Revenge, Overconfidence, Anxiety, Excitement)
- Did you trade free from emotional influence? (Yes / No)
- How calm were you during this trade? (1–5 scale)
Discipline (5 questions)
- Did you follow your risk management rules? (Yes / No)
- Rate your overall discipline. (1–5 scale)
- What was the main mistake? (None, Early Entry, Late Entry, Early Exit, Late Exit, Wrong Position Size, Moved Stop Loss, No Stop Loss, Revenge Trading, FOMO Entry)
- Would you take this trade again? (Yes / No)
- Rate this trade overall. (1–5 scale)
Your answers do more than sit in the archive: they feed the Psychology analytics, and every question also becomes a filterable field — so you can, for example, pull up all trades where you answered “No” to “Did you follow your trading plan?” (see §12). Custom questions you add become filterable in exactly the same way.
5.6 Trade Mentor
The Trade Mentor is a rule-based advisory system that generates contextual, personalized insights for each trade. It analyzes your trade against your own historical performance baseline to surface actionable observations about risk, execution, fees, and patterns.
The Mentor works for trades in all phases:
Planned / Pre-trade
Insights about your plan: whether a stop loss is missing, how solid or thin your planned risk-reward ratio looks, and how much of the account you’re risking — with a flag when it’s above your usual.
Open Trade
While a trade is running: time-in-trade warnings if you’re outside your typical holding range, drawdown alerts, plan deviation indicators.
Closed Trade
Post-trade analysis: actual R-multiple vs. your typical R, MAE (Maximum Adverse Excursion) — how close you came to being stopped out, MFE capture ratio — how much of the available move you captured, how far the trade gave back from its peak (ETD), entry slippage in pips, fee impact as a percentage of the trade’s gross P/L, holding time in context of your winning vs. losing durations, and a strategy-context card showing the historical win rate and sample size of the strategy this trade used.
Stop and target movement
When a trade’s stop or target differs from the one it was entered with, the Mentor says so: a widened stop as a warning, with how much more it put at risk; a tightened stop — and a move to breakeven — as an observation; and a target pulled in on a closed trade, with what that cost when price went on to reach the original target. Each card also compares how your trades do when you move a level with how they do when you leave it.
These cards only appear when Tradelics knows the entry level — reported by your broker or typed by you, not worked out (see §4.1). A worked-out entry stop can differ from the current one without anyone having touched it, and the Mentor will not accuse you of a move you did not make. For the same reason, figures about how often you move your stop are worded “of the trades where we can tell”.
Insights appear as a scrollable card carousel at the bottom of Trade Details. Click any dot to jump to a specific insight, or click the graduate-cap icon (its tooltip reads Open Trade Mentor) to see all insights stacked in a full detail window.
The Mentor is personal to your data — it uses your own trade history to establish the baseline, so insights become more accurate and relevant as your journal grows.
5.7 Trade Size & Units
A size of “1” means very different things on a forex account (one lot of 100,000), a crypto exchange (one coin) and a futures account (one contract). Tradelics records what each size counts alongside the number, and shows it as a word: 0.35 lots, 2 contracts, 0.5 coins, 100 shares, 35,000 units. Everything that depends on size — risk, R-multiples, the trade value — is worked out from the number and its unit, so trades from different brokers can sit side by side in one journal.
- Stored as your broker reports it. Each broker and import format states its unit. MetaTrader and FTMO report lots, cTrader reports units (with the symbol’s lot size, so Tradelics can also show lots), NinjaTrader reports contracts, Kraken, Binance and Bybit report coins. For MetaTrader 5, contract sizes and quote currencies come from the broker’s own symbol specification, including index and crypto CFDs.
- Lots or units — your choice. Preferences → Regional → Size Display decides whether forex, metals and CFD positions show in lots (0.35) or units (35,000). Futures always show contracts; coins and shares show their own quantity.
- Changing a unit by hand. In Trade Details, click the unit word beside Size to choose what the number counts. Changing the unit does not change the number — only how it is read. The table’s Edit… dialog has the same unit selector, for one trade or many.
- Unknown units are flagged, never guessed silently. If Tradelics cannot tell what a size counts, it shows the number as stored with (unit unknown). A size Tradelics had to work out from the trade’s own profit and price move is marked (estimated).
Contract specs
Most symbols need nothing: the size comes from your broker or Tradelics works it out. When a symbol’s position size looks wrong — an exotic CFD, a futures contract, an inverse crypto contract — open Symbols (Ctrl+Shift+Y) and click the ruler icon (Contract Specs) on that symbol’s row. There you can set, for all accounts or for one:
| Field | Meaning |
|---|---|
| Unit | Lots, Contracts, or the instrument itself (Shares / Coins / Units). Auto keeps what the broker or import reported. |
| Type | Linear for almost everything. Inverse only for coin-settled crypto contracts (Binance COIN-M, Bybit inverse, BitMEX). |
| Contract size | How many units one lot or contract holds: 100,000 for a forex lot, 100 for a gold lot, 50 for an ES future. In MetaTrader: right-click the symbol in Market Watch → Specification. |
| Lot size | Only for brokers that store trades in units (cTrader): how many units make one lot, so the size can also be shown in lots. It never changes P/L. |
A row for one account wins over the row for all accounts; your broker’s own value wins over both when it is synced. Symbols that have trades with an unknown unit are marked in the Symbols list.
First open after updating. The first time you open an existing journal in this version, Tradelics classifies the sizes of the trades already in it — once — and shows a short summary per account (converted to lots, inferred from P/L, set by convention, unknown). Profit and loss are not changed, trades it cannot classify keep their size exactly as it was, and a backup is taken before anything is touched (the summary shows where).
5.8 Show a Trade in TradingView, MetaTrader or cTrader
Reviewing a trade usually means finding it on a chart. The chart buttons on the trade form do that for you: pick a platform from the picker beside them, and Tradelics brings that platform to the front, switches the chart to the trade’s symbol and timeframe, and jumps to when the trade happened.
Trades from an account that syncs from MetaTrader 4, MetaTrader 5 or cTrader start on that platform; others start on the platform you used last.
| Platform | Buttons | Good to know |
|---|---|---|
| TradingView Desktop | Show (draws the trade as a Long/Short Position), Go to date (jumps without drawing), Snapshot | Open the matching symbol in TradingView first; if a different symbol is open, Tradelics asks before pasting onto it. Snapshots use TradingView’s own Ctrl+Shift+S chart copy. |
| MetaTrader 5 | Show, Snapshot | MetaTrader draws the trade itself — for the account that is logged in, so Tradelics warns you when another account is. Auto Scroll is turned off on that chart, or it would jump back to now. Windows only. |
| MetaTrader 4 | Go to, Draw, Snapshot | MT4 does not draw closed trades by itself, so Draw has the Tradelics_AutoExport expert draw entry, exit, stop and target (it must be attached to a chart; update it via Set up MetaTrader 4 in the account if asked). Click Draw again to remove the drawing. Windows only. |
| cTrader | Show, Draw, Snapshot | Works through the free Tradelics plugin for cTrader. The first time, Tradelics offers to install it: confirm in cTrader, switch it on under the puzzle-piece (Plugins) icon and allow it access. The plugin only shows, draws and photographs charts — it never trades. |
Snapshots
Snapshot photographs the chart on one or more timeframes you tick (1m to 1W, with a suggestion for the trade’s length) and adds one picture per timeframe to the trade’s gallery, captioned with the platform and timeframe. In TradingView and cTrader you can have the trade drawn on the chart first. Leave the platform alone until Tradelics comes back to the front. If the platform’s history does not reach back to the trade on a short timeframe, Tradelics tells you and adds the others.
Settings
Preferences → Charts → Chart platforms controls how the chart is placed:
- Centre the trade on the chart — show what led up to it and what followed (TradingView, MT4 and cTrader; MT5 starts the trade at the left edge). Centre vertically too does the same for the price axis in MT4.
- Fit the timeframe to the trade — pick the timeframe on which the whole trade is visible; otherwise every trade goes to your Preferred timeframe.
- Snapshot wait — seconds to wait after jumping before the picture is taken. Raise it if snapshots show a half-loaded chart.
Drawing in MetaTrader 4 and cTrader chooses what is drawn — entry and exit marks, stop and target zones, a result label, level labels, price tags — and what happens afterwards: ask each time, keep it, or remove it when you return to Tradelics. Kept drawings are named Tradelics_draw_… on the chart.
The Paste from TradingView button works the other way round: select a Long or Short Position drawing in TradingView, copy it with Ctrl+C, and paste it into the trade form.
6. Trades
The Trades view (Ctrl+2) displays all trades in a spreadsheet-like grid. It’s the fastest way to scan your trade history, sort by any column, or select multiple trades for bulk operations.
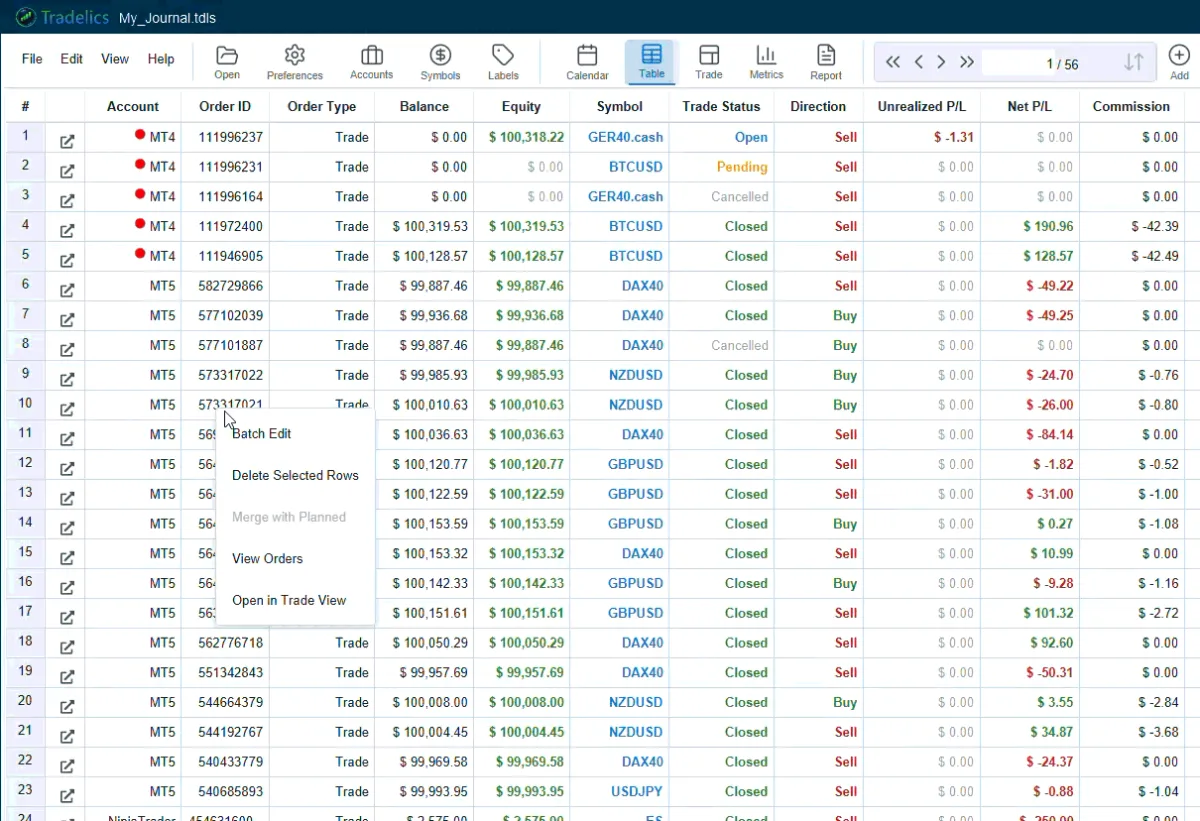
- Sorting: Click any column header to sort by that column. Click again to reverse the order. The toolbar’s Reset Sort button returns to the default order, and its First / Previous / Next / Last buttons step through the table.
- Every trade, in one list: the table holds every trade the filter lets through, however many there are, and scrolls through them smoothly.
- Multi-select: Click rows with Ctrl (individual) or Shift (range) held down, just like in a spreadsheet. Press Delete or Backspace to remove the selected rows in bulk.
- Account colour: a thin bar in the account’s colour marks each row, so mixed-account lists stay readable.
Columns and presets
The table carries far more columns than fit on screen — Trade #, account, order ID, balance and equity, symbol, status, direction, net and gross P/L, commission, swap, prices, size, notes and more. Right-click any column header for:
- Presets — ready-made layouts: Essentials, Review, Risk & execution, All columns, and your own Custom layout. Each preset remembers its own columns, order and widths. Change one and it shows as (modified); use Save preset to keep the change or Reset preset to go back to the original. Switching away from a modified preset asks whether to save it first. (An existing layout from an earlier version becomes your Custom preset.)
- Column Visibility — show or hide individual columns.
- Fit Columns to Content — size every column to what it shows. Columns fit themselves automatically until you drag an edge; double-click a column edge to fit just that one. Long headers wrap onto two lines instead of being cut off.
Two columns help with your review routine: Checklist (e.g. 3/10 rules ticked) and Review (the trade’s star rating) — sort by either to find trades that still need attention.
Editing in the table
Double-click a cell, or right-click and choose Edit…, to change a value. The same dialog works for one trade or for every selected trade (Apply to N trades), and it applies the same rules as the trade form:
- Values are checked before anything is saved; an invalid entry is named, and nothing is written.
- Tradelics warns before applying something suspicious — a stop or target on the wrong side of the entry, or a P/L that replaces the one your broker reported (your figure is then kept through later syncs).
- Columns Tradelics assigns or calculates are read-only, and the dialog says why. Prices that a trade’s P/L is calculated from, open and close times, and closing a trade are edited in the form, which recalculates the P/L with them. Trades cannot be moved into an archived account, or into an account in a different currency.
- Strategy, signal, confirmation and tag fields can create a new label on the spot. For tags, choose to add, remove or replace tags across the selection.
- Size has a unit selector (§5.7).
Every edit can be undone with Ctrl+Z, and balances, equity curve and drawdown are recalculated straight away.
Row context menu
Right-click a row (or a selection of rows) for the bulk tools:
- Edit… — the edit dialog described above.
- Delete Rows — remove the selection.
- Merge with Planned — link an executed trade to the planned trade it fulfilled. Available when exactly two rows are selected, one of them planned, with matching symbol and direction.
- View Orders — open a dialog listing the individual executions behind the trade.
- Open in Trade Details — jump to the trade in Trade Details.
The Trades view respects the active Filter (§12). Apply a filter first (e.g., “only EURUSD trades in March”) and the table, Metrics, and all other views will reflect that subset.
7. Import & Export
7.1 CSV Import
Go to File → Import → Transactions (Ctrl+I), or drag a CSV file onto the Import button in the toolbar. Tradelics automatically detects the broker format from the file’s column headers and structure.
- Select your CSV file from the file dialog (or drop it on the Import toolbar button).
- Tradelics shows a preview of the detected format and how many trades will be imported.
- Select the target account that the trades belong to.
- Review the preview, then click Import.
- Tradelics imports the trades and recalculates balances automatically.
Importing the same file twice won’t silently corrupt your data. Tradelics detects duplicates and shows them to you — split into same-account and cross-account matches — so you decide whether to overwrite the existing trades or import the duplicates as new.
A row that arrives missing a required value (for example no symbol or no direction) is imported but flagged as invalid rather than silently dropped or guessed at — the import summary tells you how many, and it stays excluded from every metric until fixed. File → Repair… (Ctrl+Shift+R) ends with a review of any invalid trades in the journal, letting you jump to each one to complete it or delete it outright.
Transactions aren’t the only thing you can move: Accounts, Symbols, and Labels each have their own entry under File → Import (and matching entries under File → Export…), which is handy for carrying your label taxonomy or symbol settings into a new journal.
7.2 Supported Broker Formats
The following broker CSV formats are auto-detected:
| Broker / Platform | Export type |
|---|---|
| MetaTrader 5 (MT5) | Full history report (CSV or HTML) |
| MetaTrader 4 (MT4) | HTML Account Statement, or the CSV produced by the bundled Tradelics_Export.mq4 script (see §4.3) — other MT4 CSVs are not auto-detected |
| cTrader | Trade history CSV export |
| Binance Futures | Futures trade history CSV |
| FTMO | FTMO account statement CSV |
| NinjaTrader 8 | Trade performance CSV export |
| TradingView | Replay-mode paper trading CSV and strategy tester CSV (both formats detected) |
| Tradelics | Re-import from a Tradelics CSV export (for moving data between journals) |
If your broker is not in this list, use Custom CSV Mapping (§7.3) to create a mapping for any CSV format.
7.3 Custom CSV Mapping
Custom mappings let you teach Tradelics how to read any CSV format — even from brokers not listed above.
The mapping editor opens from inside the Import Wizard — start an import (File → Import → Transactions) and choose to create or edit a mapping when your file isn’t auto-detected. The editor lets you:
- Map columns: Tell Tradelics which CSV column corresponds to Symbol, Direction, Entry Time, Exit Price, Profit, Commission, etc.
- Set number / date formats: Specify whether your CSV uses US decimals (1,234.56) or European decimals (1.234,56), and the date format used.
- Handle split-row format: Some brokers export entry and exit as separate rows linked by a trade ID. Enable “Split-Row Mode” and specify the ID column.
- Default values: Set a default Direction or Status for rows that don’t include that column.
- Gross vs. Net profit: Specify whether the profit column includes fees already deducted, or whether fees are in a separate column. Commission written as a negative number is read correctly too.
- What the times mean: under Times in this file are, say whether the file uses this computer’s time, UTC, or the account’s broker server time. Tradelics converts each time individually, so trades on either side of a daylight-saving change land at the right hour. (Mappings saved with the old fixed hour shift keep working as before.)
- What the Size column counts: lots, units (coins, shares, currency) or contracts — or Mixed: per instrument type… for files that hold forex, crypto and futures together, or Not sure to let Tradelics work it out from the trades. Nothing is multiplied: the number is stored as the file prints it, with its unit (§5.7).
- Notes and Tags from several columns: map more than one column to Notes, or to Tags. Tradelics checks a tag column before importing — long text or hundreds of different values belong in Notes — and shows the tags it will create.
- Levels and excursions: map planned and initial stop and target columns, and MAE / MFE columns.
The editor walks through numbered steps — saved mappings, file and header row, auto-detect, then map and preview (with arrows to page through the file’s rows). Mappings are saved by name and reused on future imports; save as a new mapping or over an existing one. You can create multiple mappings for different brokers.
When the imported trades use strategies, signals, confirmations or tags that are not in your lists yet, the import offers to add them, so you can pick and filter by them straight away.
7.4 Exporting Data
Export your trade data in three formats:
| Format | How to export | Contents |
|---|---|---|
| CSV | File → Export… → Transactions | All trade fields as a spreadsheet. Exports the entire journal, regardless of any active filter. Open in Excel, Google Sheets, or re-import into another Tradelics journal. |
| Report View → Export → PDF | A compact, printable report of the period shown: a summary page, one row per trade grouped by day, and optionally an appendix with notes, review answers and images. See §13. | |
| Word (.docx) | Report View → Export → Word | The same content as the PDF, in editable Microsoft Word format. |
Moving a journal with CSV
A Tradelics CSV export is recognised on the way back in, and it brings its own accounts with it. The import skips the account-selection and column-mapping steps entirely — there is nothing to map, because the file already names the account each trade belongs to, so a journal holding three accounts comes back as three accounts rather than being flattened into one.
Accounts in the file that do not exist in the destination journal are created for you and listed on the confirmation screen before anything is written. They take their currency from the trades themselves, and they open at a zero balance — worth setting afterwards in the Accounts manager, since drawdown and R-multiples are measured against the account’s starting balance.
Exporting to CSV and re-importing is a convenient way to merge two journals or move a subset of accounts between them. To move a journal whole, copy its folder instead — a journal is self-contained (see §1.3), and copying keeps your screenshots and account balances exactly as they are.
8. Labels Manager
Open the Labels Manager with Ctrl+L or View → Labels. This is where you create and manage all labels used for trade categorization.
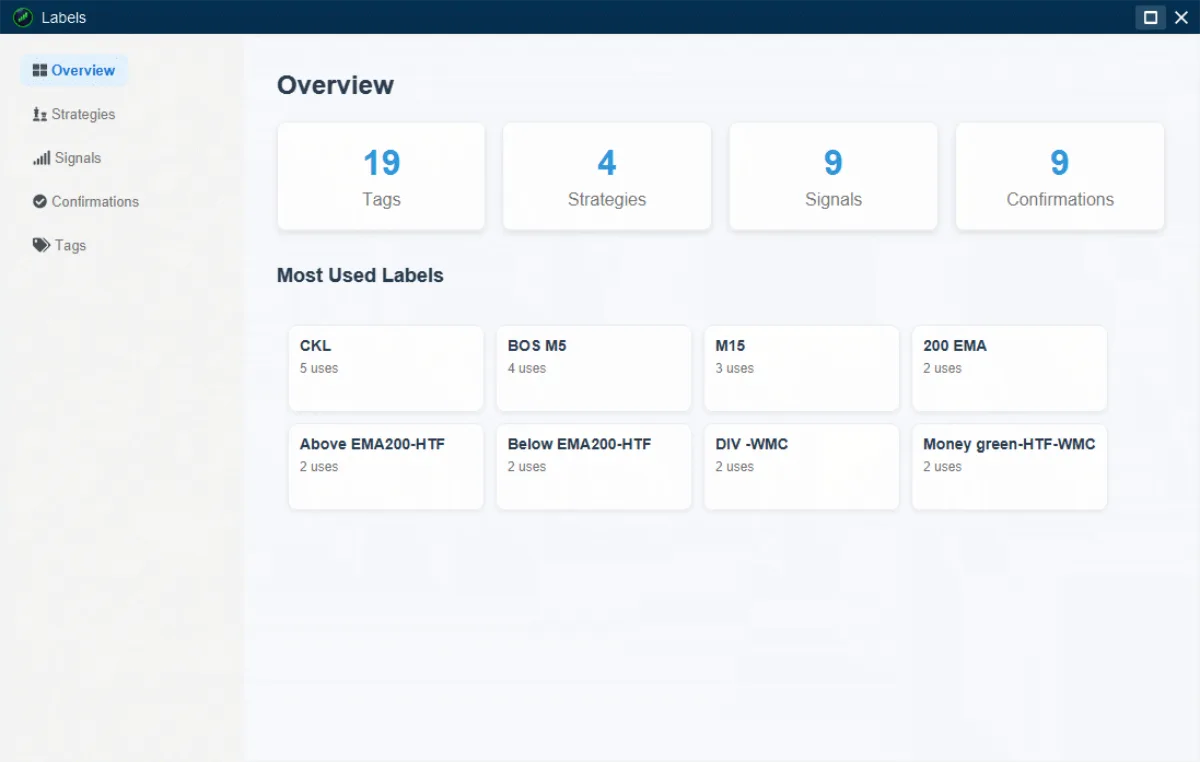
A sidebar on the left switches between five sections. The Overview is the summary page: a count card for each of the four label types, and a Most Used Labels grid showing your labels ranked by how many trades carry them. It’s the quickest way to see whether a category has grown unwieldy, or which labels you created and then never actually used.
The remaining four sections are one per label type. Within each, you can reorder labels by dragging and archive the ones you’ve retired — archived labels disappear from Trade Details dropdowns but keep their history (use Show archived to bring them back into view).
There are four label types:
Strategy
Your trading methodology or system. Best practice: create one strategy label per distinct approach you trade (e.g., “ICT”, “Supply & Demand”, “Momentum Scalping”, “Algo”). Metrics will show you win rate and profit factor per strategy, letting you identify which approach is most effective.
Signal
The specific pattern or indicator trigger that fired for this trade (e.g., “Order Block”, “Liquidity Sweep”, “Fibonacci Retracement”, “RSI Divergence”, “Inside Bar”). More granular than Strategy — one Strategy can have many Signals.
Confirmation
An additional factor you required before pulling the trigger (e.g., “HTF Alignment”, “Volume Spike at Level”, “News Catalyst”, “Market Structure Break”). Helps you evaluate whether your confirmation filters actually improve your results.
Tags
Free-form labels for anything that doesn’t fit the above. Multiple tags per trade. Common uses: emotional state (“Revenge Trade”, “FOMO”), execution quality (“Perfect Entry”, “Early Entry”), post-analysis categories (“Should Have Held”, “Broke Rules”), or session (“London Open”, “NY Session”).
Start with a small, focused set of labels rather than creating dozens upfront. Three or four strategies and five to ten signals gives you meaningful analytics without diluting each category with too few trades.
9. Symbols / Pairs Manager
Open the Symbols Manager with Ctrl+Shift+Y or View → Symbols. It lists every trading instrument that appears in your journal.
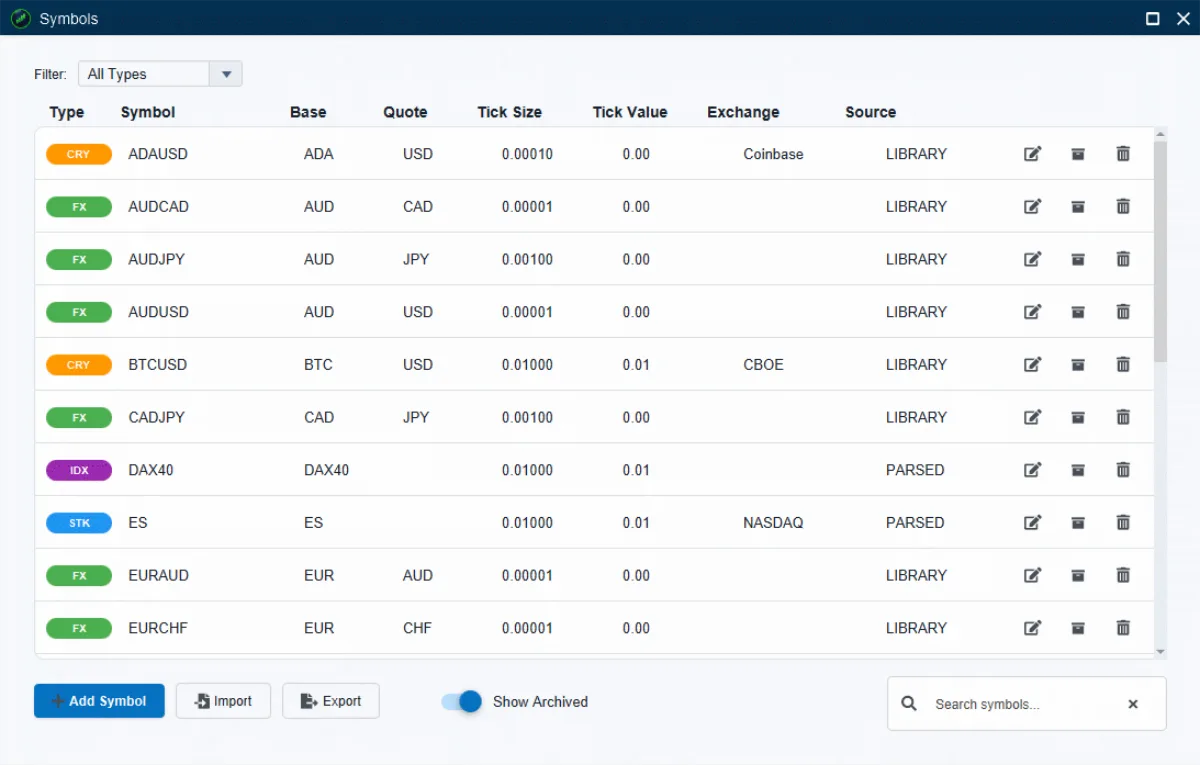
The table shows eight columns per symbol — Type, Symbol, Base, Quote, Tick Size, Tick Value, Exchange, and Source — and the toolbar above it offers a type filter, a search box, Import / Export buttons, a Show archived toggle, and Add Symbol for manual entries.
Tick Size
Tick size controls how many decimal places Tradelics uses when displaying prices for that instrument. When a new symbol appears via import or sync, Tradelics resolves the tick size automatically: it first checks its built-in symbol library (stripping common broker prefixes like PF_ or FX_ if needed), then falls back to pattern-matching the symbol name, and finally to a generic default of 0.01. If actual trade prices show more precision than the current setting, the tick size is refined to match — it only ever becomes more precise, never less. You can override it manually at any time.
The Source column records how each symbol was resolved (library, parsed, or manual) — a quick way to spot an auto-detection that guessed wrong.
Tick Value
Separate from tick size, the Tick Value is the monetary worth of one tick. For futures-style instruments it feeds the P&L calculation, so check it if a futures trade’s calculated profit looks off.
| Instrument type | Typical tick size |
|---|---|
| Forex majors (EURUSD, etc.) | 0.00001 (5 decimal places) |
| Forex JPY pairs (USDJPY, etc.) | 0.001 (3 decimal places) |
| Stocks & indices (US) | 0.01 (2 decimal places) |
| Crypto (BTCUSDT) | 0.01 or 1.0 (varies by exchange) |
| Futures (ES, NQ) | 0.25 (quarter-point) |
If a symbol is not auto-detected (e.g., a custom CFD), click Add Symbol to create it manually with the correct tick size.
Contract Specs
The ruler icon on each row opens the symbol’s Contract Specs: its size unit, contract size and lot size, for all accounts or per account. You rarely need it — see §5.7 for when and how. A symbol whose trades have an unknown size unit is marked in the list.
10. Calendar View
Press Ctrl+1 or click Calendar in the toolbar to switch to the Calendar View.
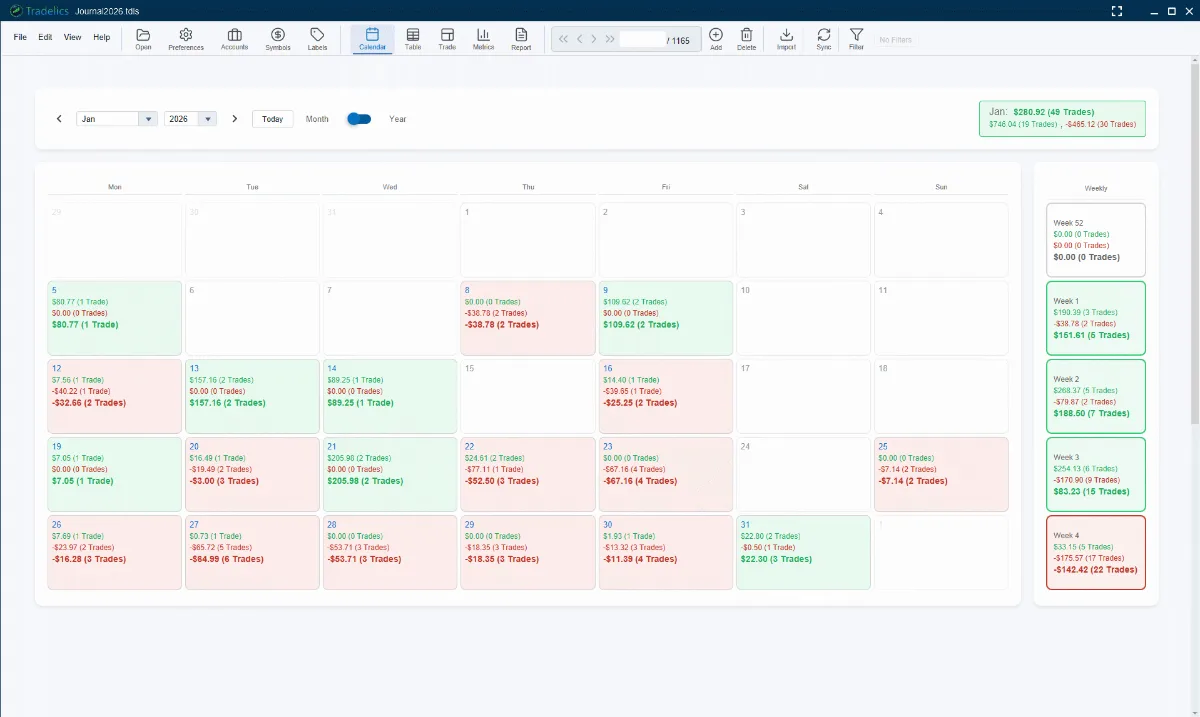
The calendar shows your trading performance day by day on a monthly grid:
- Green days — net profitable day. Red days — net losing day. Days with no activity stay neutral.
- Each day cell shows the day’s wins and losses counts, plus the net P&L and total trade count.
- A weekly summary column on the right totals each week; a month summary shows the month’s P&L, wins, and losses.
Click any day to drill down: a details dialog opens listing that day’s individual trades (your active filter stays untouched). The weekly and monthly summaries are clickable in the same way for week- and month-level details.
The calendar sizes itself to the window, so a full month fits on a laptop screen; on a very narrow window the page scrolls sideways instead of squeezing the cells.
Use the month/year navigation — or the Today button — to move around. The calendar respects the active filter, so filter to a specific account or symbol to see only that subset. Trades are placed on the day they were closed; open trades without a close time don’t appear on the calendar. Whether weeks start on Sunday or Monday is set in Preferences → Regional.
The Calendar View is one of the fastest ways to spot patterns: do you consistently lose on Mondays? Do you over-trade after a losing week? These patterns become immediately visible.
11. Metrics & Statistics
Press Ctrl+4 or click Metrics in the toolbar. The sidebar on the left lists 18 analysis pages — the Dashboard, then three labelled groups; the main area displays the selected analysis.
Metrics always reflect the active filter. To analyze a specific subset — e.g., only EURUSD trades in Q1, or only trades using the “Breakout” strategy — apply your filter first (§12), then open Metrics. All performance metrics are computed over closed trades only; open and pending positions are excluded until they close.
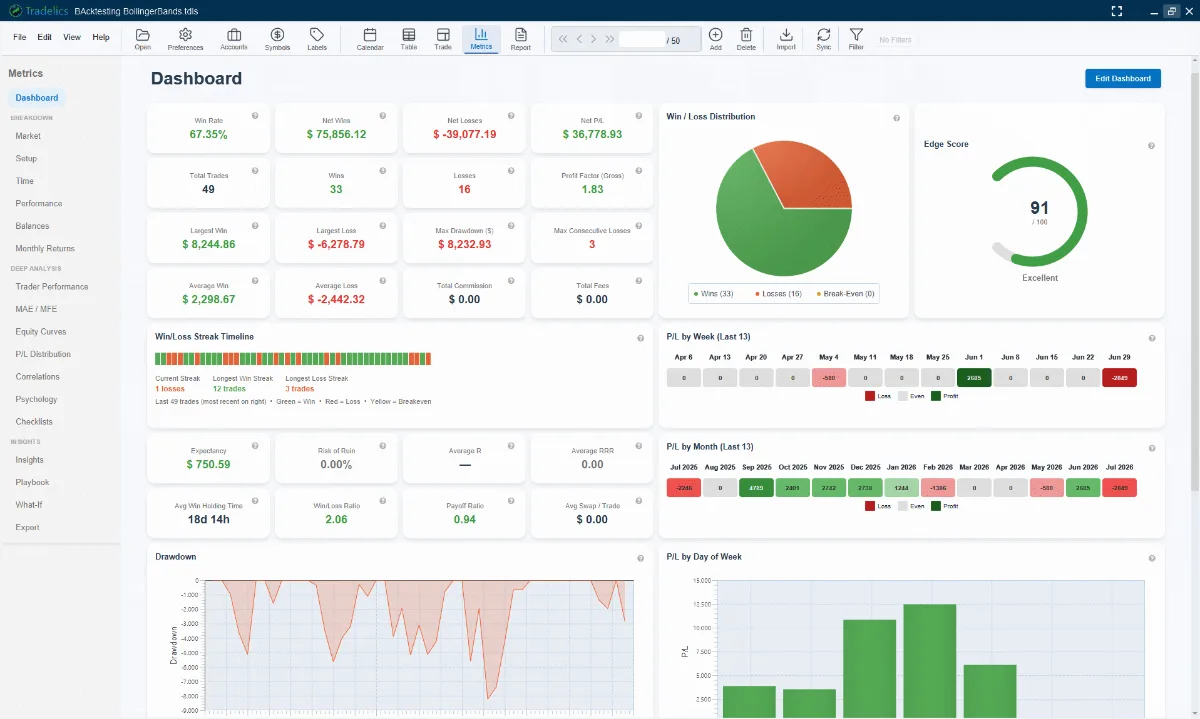
11.1 Dashboard & Edge Score
The Dashboard is where Tradelics opens, and it carries both halves of the picture: the headline numbers, and the trades behind them. Seeing a figure and seeing what produced it no longer means switching views. It is also yours to arrange — add, remove, resize and reposition the widgets through Edit Dashboard to build the page you actually want to see. First-time users start from a sensible default layout.
The default layout runs top to bottom as:
- Sixteen KPI cards, with the Win/Loss distribution pie, the Edge Score ring and the win/loss streak timeline beside them. The cards are deliberately not every metric that exists: figures the pie and the timeline already state are left out, so no number on the opening screen is printed twice. Everything omitted is still available from Edit Dashboard.
- Open Positions — what is live right now, with its unrealized P/L.
- Recent Trades — what most recently closed. Use the selector in its header to choose how many to show.
- P/L by week and P/L by month, then the drawdown curve beside P/L by day of week, then P/L by strategy beside P/L by symbol.
- Outcome Distribution — a histogram of your trade results — beside Risk-Adjusted Ratios.
Both trade tables size themselves to their content, so an account with nothing open costs a single line rather than an empty card. Click the icon at the end of any row to jump straight to that trade in Trade Details, and drag or resize their columns — the arrangement is remembered.
Sharpe and Sortino in Risk-Adjusted Ratios are shown without a “good” threshold, on purpose. Tradelics computes them per trade, while the familiar benchmarks you may have in mind describe annualized values — marking one against the other would paint perfectly healthy accounts red.
Edge Score — Tradelics Concept
The Edge Score is a composite 0–100 score that measures the overall quality of your trading edge. It combines five dimensions:
| Component | Weight | What it measures |
|---|---|---|
| Expectancy | 30% | Average profit per trade — the foundation of your edge |
| Win Rate | 20% | Consistency of profitable outcomes |
| Max Drawdown | 20% | Risk control — how much you lose in bad periods |
| Recovery Factor | 15% | How quickly you recover from drawdowns |
| Profit Factor | 15% | Gross wins relative to gross losses |
Interpretation: ≥ 70 = Green (strong edge) · 40–69 = Amber (developing edge) · < 40 = Red (edge not yet established)
Based on Van K. Tharp’s System Quality framework and Ralph Vince’s recovery/profit factor concepts.
The expectancy that feeds the Edge Score is the classic (Win Rate × Avg Win) − (Loss Rate × Avg Loss) formula, which can differ slightly from the Expectancy metric displayed elsewhere (Net P&L ÷ Total Trades) whenever you have break-even trades.
11.2 All Metrics Defined
Core Performance
| Metric | Definition |
|---|---|
| Total Trades | Total number of closed trades in the analysis period. Break-even trades are included. |
| Win Rate | Percentage of trades that were profitable (by net P&L). |
| Loss Rate | Percentage of trades that were losing trades (by net P&L). |
| Break Even | Number of trades whose net P&L falls within the break-even tolerance (see the note below). |
| Win/Loss Ratio | Number of winning trades divided by losing trades. |
| Profit Factor (shown as “Profit Factor (Gross)”) | Total gross profit divided by total gross loss. Values above 1.0 indicate a net positive system; above 1.5 is considered solid. Displays as ∞ when there are gross wins but no gross losses. |
| Profit Factor (Net) | The same ratio computed on net figures: net wins divided by the absolute value of net losses. |
| Net P&L | Net profit/loss after all fees (commission + swap), summed over every trade including break-evens. |
| Gross P&L | Total profit/loss before fees are deducted, summed over every trade. |
| Gross Wins | Sum of trades that were winners before fees. |
| Gross Losses | Sum of trades that were losers before fees. |
| Net Wins | Sum of trades that were winners after fees. |
| Net Losses | Sum of trades that were losers after fees. |
| First / Last Trade Date | The close dates of the earliest and latest trades in the analyzed set. |
Two classification details worth knowing. First, the Break Even Tolerance (set in Preferences → Metrics, default 0): a trade whose net P&L is within ±tolerance of zero counts as break-even — it is neither a win nor a loss, but it does stay in the Total Trades denominator. That’s why Win Rate + Loss Rate can add up to less than 100%, and why Net P&L isn’t simply Net Wins + Net Losses. The tolerance is an amount in your base currency, so in a multi-currency journal it is compared against each trade’s converted P&L — which is why a trade can sit just inside the band and contribute nothing to Avg Win or Avg Loss while still counting in Net P&L. Second, win/loss classification is always by net P&L — except for Gross Wins and Gross Losses, which classify by gross, so a trade whose fees turned a small gross profit into a net loss appears in both Gross Wins and (as a loss) in the net-based counts.
Per-Trade Averages
| Metric | Definition |
|---|---|
| Avg Trade | Average net profit per trade (after all fees deducted). |
| Avg Win | Average net profit of winning trades (after all fees deducted). |
| Avg Loss | Average net loss of losing trades (after all fees deducted). |
| Payoff Ratio | Win amount divided by loss amount — i.e., Average Win ÷ Average Loss. |
| Expectancy | Average net profit (or loss) you can expect per trade. Calculated as Net P&L ÷ Total Trades — which makes it the same number as Avg Trade; it’s listed under both names because “expectancy” is the term most trading literature uses. Positive means your strategy has an edge; negative means it loses on average. |
| Expectancy in R | Expected R-multiple per trade: (Win% × Avg Win R) − (Loss% × Avg Loss R). Needs an entry stop (Initial SL) on the trade; break-even trades (R = 0) are left out of both the win and loss sides. |
| Avg R | The reward-to-risk you actually realized: each trade’s net profit ÷ what it had at risk when you entered it (entry-to-stop distance × size, measured from the fill and the Initial SL), averaged. Moving your stop afterwards does not change it. Unlike Avg Planned RRR this is signed, so losses pull it down — a full stop-out is −1R. Only calculated for trades with an entry stop; R Coverage beside it says how many that is. |
| Avg Planned RRR | The reward-to-risk you planned: take-profit distance ÷ stop-loss distance (|TP − entry| ÷ |entry − SL|), averaged over the trades where you set both levels. Trades without a TP or SL are skipped rather than counted as zero, so this measures the shape of the setups you chose — before the market had any say. Because it compares two distances on the same instrument, contract size and tick value cancel out and the figure is directly comparable across forex, futures and crypto in one journal. |
| Planned RRR Coverage | The percentage of closed trades that recorded both a take-profit and a stop-loss — in other words, how much of your journal Avg Planned RRR is actually based on. Check it before trusting that ratio: a tidy 3.5 drawn from four trades out of two hundred says very little. Low coverage is itself a finding, since it means most of your trades were taken without a written target to measure against. |
| Largest Win | Biggest single profitable trade (net profit after fees). |
| Largest Loss | Biggest single losing trade (net loss after fees). |
Read Avg Planned RRR and Avg R side by side — it is the most useful pairing on this page. Planning 3:1 while realizing 0.5R says your entries are fine and your exits are costing you: winners cut early, or stops widened. If the two sit close together, your execution is following the plan and any problem lies in setup selection instead.
Risk & Drawdown
| Metric | Definition |
|---|---|
| Max Drawdown | Largest peak-to-trough decline in your cumulative P&L. Computed on cumulative trade P&L rather than the account balance, so it works the same regardless of your initial balance. Measures the worst losing period in absolute terms. |
| Max Drawdown % | Max drawdown expressed as a percentage of the peak account balance at the time (falling back to peak cumulative P&L if balance data isn’t available). |
| Max Drawdown Duration | How long the single largest drawdown lasted, measured from its peak to its lowest point (not to the eventual recovery). |
| Absolute Drawdown | How far your cumulative P&L fell below its starting point — i.e., the deepest you were ever underwater relative to where you began, not relative to a peak. This is the figure prop firms typically measure against a fixed maximum-loss floor. |
| Recovery Factor | Net profit divided by max drawdown — higher values mean your gains dwarf your worst losing stretch. |
| Calmar Ratio | Return relative to worst-case loss. In Tradelics it is computed from the same two inputs as Recovery Factor (net profit ÷ max drawdown), so the two rows show the same value — Calmar is listed for traders who know the metric by that name. |
| Sharpe Ratio | Risk-adjusted return: mean per-trade P&L divided by the standard deviation of per-trade P&L. Note this is computed on per-trade currency amounts and is not annualized, so it isn’t directly comparable to annualized Sharpe figures quoted for funds — use it to compare your own periods and strategies against each other. |
| Sortino Ratio | Like Sharpe but only penalizes downside volatility (losses), not upside volatility. Higher is better. Displays as ∞ when there is no downside volatility to measure. |
| Standard Deviation | Variability of trade P&L — lower means more consistent results trade-to-trade. |
| Risk of Ruin | Estimated probability of eventually losing your trading capital, derived from your win rate and payoff ratio assuming a standard 2% of capital risked per trade — the calculation uses that fixed assumption rather than your own per-trade risk. The number falls steeply as your edge widens, so anything above a fraction of a percent deserves attention. One threshold matters most: if win rate × payoff ratio no longer covers your loss rate, the edge is gone and this reads a flat 100% — the model’s way of saying that a system with no edge is ruined eventually, whatever the position sizing. |
| Kelly Criterion | Optimal fraction of capital to risk per trade based on win rate and payoff ratio, shown as a percentage. Floored at 0 — a negative Kelly (no edge) displays as 0%. A guideline only; most traders use half-Kelly or less. |
Streaks
| Metric | Definition |
|---|---|
| Max Wins in a Row | Longest consecutive winning streak. |
| Max Losses in a Row (shown as “Max Consecutive Losses”) | Longest consecutive losing streak. |
Streaks follow the order the trades are listed in. Under the default chronological order this is what you’d expect; if you’ve sorted the table by another column, the streak numbers reflect that order instead.
Fees
| Metric | Definition |
|---|---|
| Total Commission | Sum of all trading commissions in the period. Fee totals are signed, so a rebate or credit reduces the total rather than adding to it. |
| Total Swap | Sum of all overnight holding costs/gains — again signed, so swap credits offset swap charges. |
| Total Fees | Commission and swap combined. |
| Avg Commission / Trade | Total commission divided by all trades in the period (including trades that paid none). |
| Avg Swap / Trade | Total swap divided by all trades in the period. |
| Avg Slippage | Average difference between planned entry price (order price) and actual fill price, expressed in price units — not currency. The sign is adjusted for direction so that positive always means a worse fill, and market orders (which have no order price) are excluded. |
All P&L values in Tradelics are net of fees. This means Avg Trade, Expectancy, Avg Win, Avg Loss, and every other profit-based metric already reflects commission and swap deducted.
Holding Time
| Metric | Definition |
|---|---|
| Avg Holding Time | Average duration trades are held open across all trades in the period. |
| Avg Win Holding Time | Average duration of winning trades specifically. |
| Avg Loss Holding Time | Average duration of losing trades specifically. |
| Median Holding Time | Median (middle value) duration trades are held open — less affected by outlier very long or short trades than the average. |
Advanced
| Metric | Definition |
|---|---|
| Cumulative P&L | Running total of trade profits/losses over time — this is your equity curve in number form. |
| Edge Score | Composite score (0–100) combining expectancy, win rate, drawdown, recovery, and profit factor. See §11.1 above. |
MAE / MFE
| Metric | Definition |
|---|---|
| MAE Efficiency | How well you manage adverse moves — average profit relative to max adverse excursion, measured over winning trades only. Higher = better stop placement. |
| MFE Capture Ratio | How much of favorable price movement you actually capture — average profit relative to max favorable excursion, measured over all trades that had a favorable move. Losing trades drag this ratio down (even negative), which is the point: it shows profit given back. |
| MAE/MFE Data Coverage | Percentage of trades that have both MAE and MFE data recorded. This data is typically available from MT5 and NinjaTrader exports. |
| R-Data Coverage | Percentage of closed trades an R could be calculated for — the ones with an entry stop. Avg R and Expectancy in R rest on these trades only. |
Psychology & Review
The Psychology page summarizes your Trade Review answers in four headline figures. Each is computed over the reviewed trades that actually answered the relevant question — not over all trades.
| Metric | Definition |
|---|---|
| Reviewed Trades | Number of trades with completed Trade Review responses. |
| Avg Discipline | Average self-rated discipline score (1–5) across reviewed trades. |
| Plan Adherence | Percentage of reviewed trades where you reported following your trading plan. |
| Emotion Free | Percentage of reviewed trades where you answered “Yes” to trading free from emotional influence. Higher is better — emotionally influenced trades usually correlate with worse outcomes. |
Every other review question — trade rating, risk-management adherence, mistakes, and the rest — is broken down question by question in the Trader Performance page (see §11.3), which builds a per-question grid across all your reviewed trades.
11.3 Analysis Categories (Sidebar)
The sidebar lists 18 analysis pages: the Dashboard on its own at the top, then three labelled groups. Several pages have sub-tabs of their own — Market and Setup each offer Charts and Tables views, and Time adds a Heatmap alongside them.
| Page | What it shows |
|---|---|
| Dashboard | Your customizable metrics home page — Edge Score gauge, key metric cards, win/loss summary (see §11.1) |
| Breakdown | |
| Market | Performance broken down by trading instrument (pair/symbol), as charts or tables |
| Setup | Performance by Strategy, Signal, and Confirmation labels — reveals which setups actually work |
| Time | Performance by hour of day, day of week, month, and session — including a heatmap grid showing where you make and lose money |
| Performance | Rolling performance windows over recent months, weeks, and days. How many of each are shown is set in Preferences → Metrics → Performance View Periods |
| Balances | Account balance history and running equity tracking per account |
| Monthly Returns | Month-by-month P&L table and cumulative return chart |
| Deep Analysis | |
| Trader Performance | A question-by-question grid of your Trade Review answers across all reviewed trades — how your self-assessments relate to results |
| MAE / MFE | Maximum Adverse/Favorable Excursion charts — see how far against you each trade went before closing |
| Equity Curves | Account balance progression over time with drawdown periods highlighted |
| P/L Distribution | Histogram of trade outcomes — the shape reveals whether you have fat tails (large wins/losses) or a tight distribution |
| Correlations | Correlation matrix between instruments — reveals whether your trades are diversified or clustered |
| Psychology | Analysis of Trade Review responses — emotion vs. performance, discipline vs. win rate, revenge-trading detection (see §11.5) |
| Checklists | Pre-trade and post-trade checklist templates for systematic trade review |
| Insights | |
| Insights | Automatically generated textual insights and observations about your trading patterns |
| Playbook | Trade setup catalog grouped by Signal label, showing historical P&L, win rate, and avg holding time per setup |
| What-If | Scenario analysis: “What if I had removed my 10 worst trades?”, “What if I had exited at MFE peak?”, “What if I had capped every loss?” Exclude Days lets you switch off any weekdays (Mon–Sun) to see your results without them. |
| Export | Export all metrics and charts to PDF, Excel, or CSV |
The day-by-day Calendar isn’t in this sidebar — it’s a main view of its own, reached with Ctrl+1 or the Calendar toolbar button (see §10).
11.4 MAE / MFE Analysis
MAE (Maximum Adverse Excursion) is the maximum amount a trade moved against you before it closed. MFE (Maximum Favorable Excursion) is the maximum amount a trade moved in your favor before it closed.
These metrics require excursion data for each trade, which not every broker provides — it is typically available from MT5 and NinjaTrader exports. The coverage percentage is shown as MAE/MFE Data Coverage.
Missing values on MT5 trades are usually one of two things: a trade synced before the excursion calculation could reach it (fixed with Fetch missing data, §4.1), or a trade older than MetaTrader’s own 1-minute chart history (see §4.2).
What MAE/MFE tells you
- High MAE on winners: Your winners almost got stopped out. This may indicate your stops are too tight, or you’re holding through too much heat unnecessarily.
- Low MFE capture on winners: Your winners had much more available upside than you captured. You may be exiting too early.
- High MAE on losers: Your losers drew down significantly before being stopped. Combined with stop discipline data, this may reveal stop-moving behavior.
11.5 Psychology Analysis
The Psychology page (Metrics → Psychology) aggregates your Trade Review responses and surfaces behavioral patterns:
- Win Rate by Emotion: How does your performance change with your emotional state — do “Calm” trades outperform “Fear” or “Greed” trades?
- Win Rate by Discipline: Your win rate broken down by self-rated discipline level (1–5) — the clearest picture of whether discipline actually pays in your trading.
- Plan followed vs. not followed: A side-by-side comparison of results on trades where you stuck to the plan against trades where you broke it.
- Revenge Trading Detection: Compares performance on trades taken right after 3+ consecutive losses against your normal trades. Needs at least 10 closed trades with P&L before it activates.
Remember that these breakdowns are built from reviewed trades that answered the relevant question — the more consistently you fill in reviews, the more trustworthy the patterns.
The Psychology tab becomes most valuable after you’ve reviewed 30+ trades. Fill in Trade Reviews consistently — even 2 minutes per trade gives you meaningful data over time.
12. Filtering Trades
Press Ctrl+6 or click Filter in the toolbar to open the Filter panel.
Filters apply across all views simultaneously. When a filter is active, the Trades view, Trade Details, Calendar, Metrics, and Reports all show only the filtered subset of trades. This lets you analyze any slice of your trading history with the full power of all views.
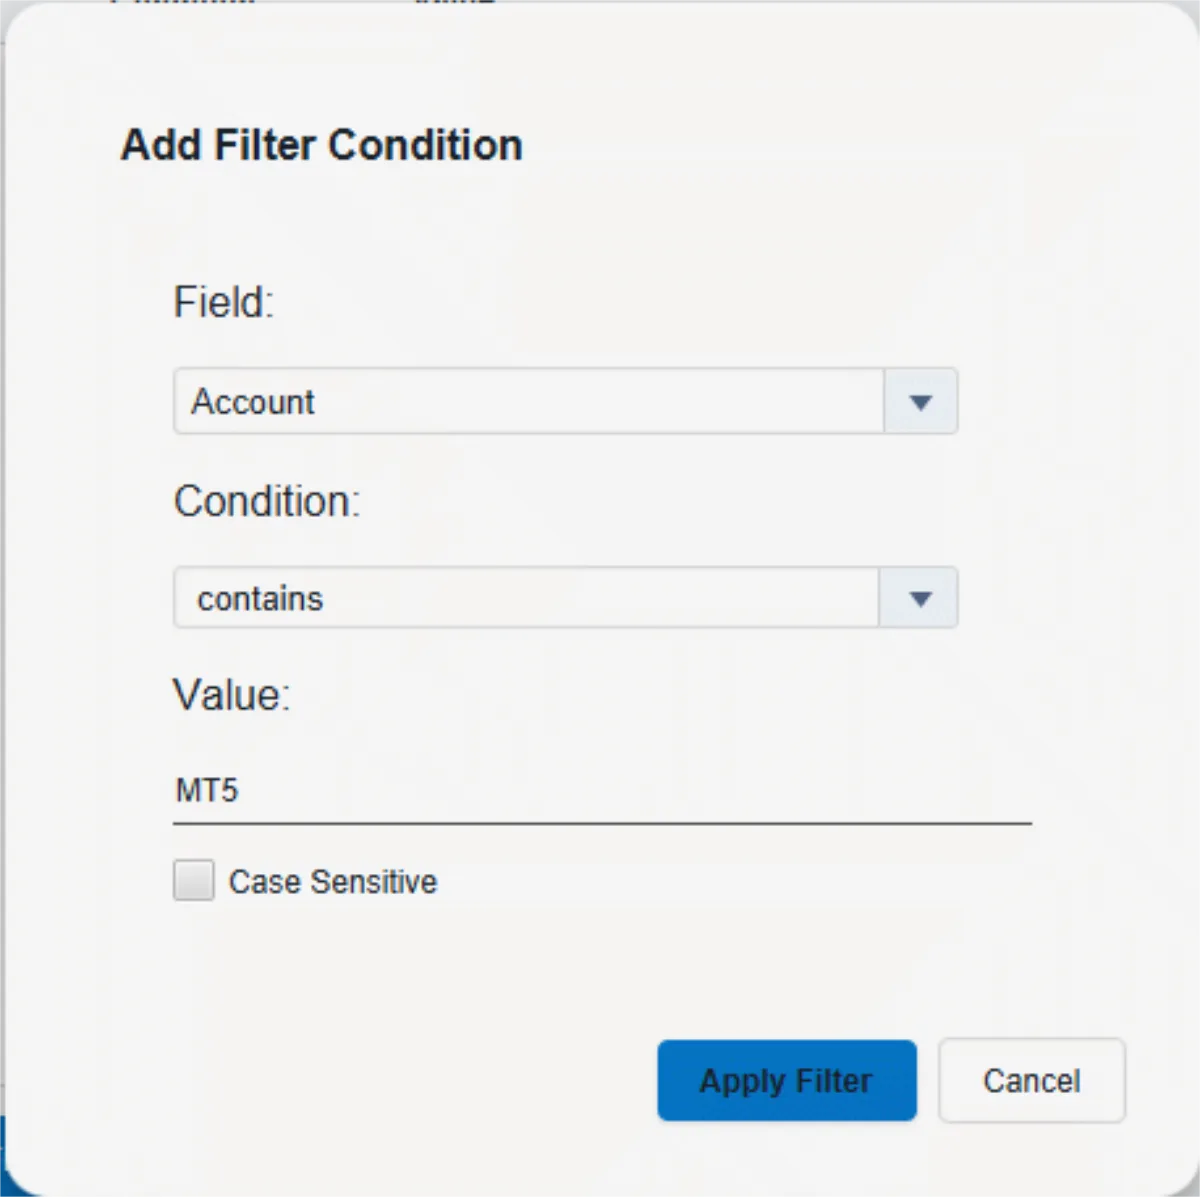
The Filter panel is a condition builder: each row is a Field / Condition / Value triple, and you can stack as many rows as you like with Add Filter. A results label in the panel shows how many trades match the current conditions; Clear All returns to the full journal.
You can tell at a glance whether anything is filtered without opening the panel: a status label sits beside the Filter button in the toolbar, reading No Filters when you’re seeing the whole journal.
Nearly every trade field is filterable — account, symbol, direction, open and close time, profit, commission, quantity, status, labels, tags, and more. The available conditions adapt to the field’s type: date fields get before/after/between, numeric fields get greater/less/equals, text fields get contains, and so on. Some examples of what a single condition can do:
| You want | Condition to build |
|---|---|
| One account only | account is MyAccount |
| A date range | openTime (or closeTime) between two dates — handy for a specific month, quarter, or challenge period |
| Only EURUSD trades | pair is EURUSD |
| Only winners | profit greater than 0 |
| Only actual trades (no deposits/withdrawals) | orderType is trade |
| Trades carrying a tag | tags contains Revenge Trade |
| Trades you haven’t labelled yet | strategy is empty — then select them all in the Trades view and assign a strategy in one edit |
- is empty / is not empty work on every text field, so missing strategies, signals, tags or notes are easy to find.
- between includes both ends of the range, and asks for both.
- is not and does not contain also match trades where the field is empty.
If a condition can’t be used — a saved filter from another version, say, or a value that isn’t valid for its field — Tradelics tells you which condition and why, and shows every trade rather than silently showing a wrong subset. Edit or remove that condition to filter again.
Filtering by Trade Review answers
Perhaps the most powerful thing in the panel: every Trade Review question is available as a filter field. Yes/no and choice questions filter with is / is not / contains; the 1–5 rating questions support numeric comparisons. Want to see every trade where you rated your discipline 2 or lower, or every trade you admitted was a FOMO entry? Two clicks.
Saved filters
Filter sets can be saved by name and reloaded from a dropdown — build your go-to slices (“This month’s shorts”, “Rule breaks”, “A+ setups only”) once and switch between them instantly. You can also temporarily deactivate individual conditions without deleting them, and toggle whether inactive conditions are shown, so a complex filter can be parked and revived at will.
Combine conditions for powerful analysis. Example: “Short trades on GBPUSD using my ‘Supply Zone’ signal in Q1 2025” — then open Metrics to see the stats for that exact combination.
13. Reports
Press Ctrl+5 or click Report in the toolbar. The report opens as one of the main views, inside the main window, and is built for reading back a stretch of trading — today’s session, last week, the month so far.
The toolbar
- Period — Today, Yesterday, This week, Last week, This month or a Custom range. A trade belongs to the day it closed (an open trade to the day it opened). Weeks start on the day set in Preferences → Regional.
- Simple / Detailed — Simple shows one row per trade (time, symbol, direction, net P/L, R, strategy, tags). Detailed shows each trade as a card with the fields you choose, its notes, review answers and image thumbnails.
- Fields — choose what the Detailed cards and the exports show, grouped into P/L & account, prices & levels, execution, timing, trade details and sections (notes, review).
- Export — PDF or Word (see below).
Period, mode and field choices are remembered.
What the page shows
- A summary strip for the period: net P/L, closed trades (plus how many are still open), win rate, average R and the share of checklist rules followed — the same figures as the Metrics view.
- The trades grouped by day, each day with its trade count and net P/L, and a day list on the left that jumps to a day.
- Click a trade to open it in Trade Details; click a thumbnail to open the image with its markings.
The report follows the app’s theme, and it respects the active filter: a note in the toolbar says when a filter is narrowing it. If a period is empty, the page says so and suggests checking the filter.
Export
The export is a compact, printable document — separate from the on-screen page — covering exactly the trades the report shows: a summary page with the headline figures and each day’s totals, then one table row per trade grouped by day. Before exporting, Tradelics asks whether to add an appendix with each trade’s notes, review answers and images (following the Fields menu) or export the table only. Pages are numbered and the file name carries the period.
| Format | Best for |
|---|---|
| Sharing with mentors, prop firm submission, printing, archiving. | |
| Word (.docx) | Editing the report, adding your own commentary, submitting to a trading coach. |
For a weekly review with your trading coach or mentor: pick Last week, switch to Detailed to read through it, then Export → PDF with the appendix. Your notes, screenshots and Trade Review answers are all in one clean document.
14. Preferences
Open Preferences with Ctrl+, (comma) or File → Preferences.
Preferences are organized into seven sections: Appearance, Regional, Sync/Import, System, Metrics, Charts and AI assistant. (Report settings now live in the Report view’s own toolbar — see §13.)
The blue ? icons throughout Preferences and the dialogs explain the setting beside them: hover to read, or click to pin the text open while you work (click again, click elsewhere or press Esc to close it).
Appearance
Choose from three themes:
| Theme | Best for |
|---|---|
| Light | Default. Bright environments, printing reports, users who prefer a traditional app appearance. |
| Dark Blue | Easy on the eyes during long sessions, good for multi-monitor setups with other dark-themed platforms (MT5, TradingView). |
| Dark Black | Maximum contrast dark theme. Ideal for OLED screens or users who prefer pure black backgrounds. |
Theme changes apply immediately without requiring a restart. The Appearance section also holds:
- Toolbar labels — hide the text labels for a compact, icon-only toolbar (tooltips remain).
- Trade Details Layout — arrange the three panels of Trade Details (Trade Form, Image Gallery, Strategy & Labels) in any of six orders.
- Startup — whether to show the welcome screen on startup and whether to reopen your last journal automatically.
Regional Settings
Configure how numbers, dates, and times are displayed throughout the app — plus a few settings that reach further than formatting.
Base Currency used to live here. It is not a display preference — it decides what every statistic is actually computed in — so it now sits with the settings it governs, under Metrics below.
| Setting | Options & Effect |
|---|---|
| Number Format | US / UK: 1,234.56 (dot as decimal separator)Germany: 1.234,56 (comma as decimal separator)France: 1 234,56 (space + comma)Japan: 1,234.56 (same as US but affects currency symbol placement) |
| Date Format | Six formats: yyyy-MM-dd, dd.MM.yyyy, MM/dd/yyyy, dd. MMM yyyy, MMM dd, yyyy, dd/MM/yyyy. Affects all date displays and inputs. |
| Time Format | 12-hour (e.g., 2:30 PM) or 24-hour (14:30). |
| Calendar start day | Whether calendar weeks begin on Sunday or Monday. |
| Size Display | Whether forex, metals and CFD positions show their size in Lots (0.35) or Units (35,000). Futures always show contracts; coins and shares their own quantity. See §5.7. |
| Language | The app’s display language. Changing it prompts a restart-style notice to fully apply. |
Number Format decides how amounts you type are read, as well as how they are shown. With Germany selected, typing 1.000 into an opening balance means one thousand; with US / UK it means one. Tradelics no longer tries to guess which you meant — it asks this setting — so check it matches how you write numbers before typing figures in. An entry that is not a valid number in that format is refused rather than quietly stored as zero.
This does not affect importing. CSV import auto-detects whether a file uses US or European decimal separators, and custom mappings carry their own number format, so a mismatched preference won’t corrupt an import.
There is no display-timezone setting here, and trade times are not converted when they are displayed — each trade is converted to your computer’s time zone once, as it is synced or imported, and stored that way. What varies between accounts is the broker’s clock, set per account as Server time zone (§3.3), with its default under Sync/Import below.
Sync/Import Settings
| Setting | Description |
|---|---|
| Auto-sync Notifications | Show a toast notification when a background auto-sync adds or updates trades. Off = auto-sync runs completely silently. |
| Server time zone | The default broker server time zone — used by every account left on Use default, which is how accounts start out. Almost every forex server uses EET/EEST, which is what Tradelics assumes. An account that picks its own zone ignores this (see §3.3). The figure in brackets is how far ahead that zone is of your computer right now — a reading, not the setting. |
| MT5 account-switch policy | What to do when a sync needs MT5 to switch to a different login: Ask me first, Switch without asking, or Never switch. Applies only to connections that hold credentials — one that reads the open session can never switch. See §4.2. |
| Orders cancelled at the broker | Do not import them (default) or Import them. Applies to MetaTrader 5 orders that were cancelled, expired or rejected. Imported ones get the status Cancelled and count in no statistic. See §4.2. |
Auto-sync itself — the on/off toggle and the interval — lives on each broker connection in the Account Dialog, not here, alongside its Start MetaTrader 5 when syncing setting. The account’s own server time zone sits in the Account Details section of the same dialog. See §4.7, §4.2 and §3.3.
System Settings
| Setting | Description |
|---|---|
| Automatic Update Checks | When enabled, Tradelics checks for new versions in the background (about once every 24 hours). You can always check manually via Help → Check for Updates. This is a safety net rather than the way updates arrive — see the note below. |
Automatic Backups
| Setting | Description |
|---|---|
| Back up every | How often Tradelics copies the open journal on its own: Off, 15 minutes, 30 minutes (default), 1 hour, or 4 hours. |
| Automatic backups to keep | How many timed and on-closing copies are kept before the oldest is rotated away — 5, 10 (default), 20 or 50. Copies taken before an import, and ones you take yourself with Back up now, are kept on their own budget and are never rotated out by the timer. |
| Back up when closing | Takes one more copy as Tradelics shuts down, so a long editing session that was never synced is still covered. On by default. |
| Disk usage | How many backups the open journal has, and how much space they take. |
| Back up now | Takes a copy immediately and tells you its file name. |
| Open Folder | Opens the journal’s backups folder in File Explorer. |
The whole feature is described in §16.2.
Updates install themselves. Tradelics comes from the Microsoft Store, and Windows keeps it current — a new version usually arrives on its own within a day, with nothing for you to download or run. The update check exists for the cases Windows does not reach: Store updates switched off, a metered connection deferring them, or Tradelics left running across a release. When it does find something, it opens the Store listing so Windows can install it. Never install Tradelics from a downloaded package file — that installs a second copy alongside your Store one instead of updating it, and the copy never updates again.
Metrics Settings
| Setting | Description |
|---|---|
| Base Currency | The currency every statistic is computed in when a journal holds accounts in more than one. Each trade is converted individually, at the rate published for the day it closed, so accounts in different currencies can be added together — see §3.5. A journal whose accounts all share one currency ignores this setting entirely. It reaches only the statistics pages: the trade table, the accounts page and exported reports always show each trade in its own currency. |
| Break Even Tolerance | The most consequential metrics setting. Trades whose net P&L is within ±this amount of zero are classified as break-even — counted in neither wins nor losses, though they remain in Total Trades. The default is 0 (only an exactly-zero trade is break-even). Raise it if tiny residual P&L amounts — a few cents of rounding, or a broker’s break-even stop-outs — are polluting your win/loss stats. The amount is in your base currency, which is what the field’s label shows; changing the base currency converts it, so the band keeps its size rather than just its digits. See the classification note in §11.2. |
| Performance View Periods | How many recent months, weeks, and days the Metrics → Performance page displays. |
Charts
Trade charts are not part of this version yet, but Tradelics already stores the price history they will need (see §4.1), because minute bars not captured today often cannot be fetched later. This page shows what is stored and lets you control it.
| Setting | Description |
|---|---|
| Context either side | Extra days of price history stored before and after each trade, so its chart can show the run-up and the aftermath: 0 to 5 days, default 1. More context makes a first fetch take longer and has little effect on later syncs. It applies to history captured from now on — run Fetch missing data on an account to extend trades already captured. |
| Stored price history | How much disk space the stored history takes in total, then one row per source — each MetaTrader 5 server, and the MetaTrader 4 bar files — with its size, how many symbols it covers, and a Clear button. |
| Clear everything | Deletes all stored price history, including the MetaTrader 4 files. You are asked to confirm first. |
Clearing cannot be taken back, and some of it may never come back. Brokers stop serving minute history after a while, so bars you delete may not be possible to fetch again. Tradelics never deletes price history on its own for the same reason — only you do, from this page. The MetaTrader 4 files are the only copy until a future version imports them.
The history is stored once per computer, not per journal: a price bar describes the market, not your trading, so every journal on the machine shares it.
Chart platforms
The lower part of the Charts page sets how the trade form’s chart buttons place a trade in TradingView, MetaTrader 4/5 and cTrader — centring, timeframe fitting, preferred timeframe and snapshot wait — and what the Draw button draws in MetaTrader 4 and cTrader. Each setting is explained in §5.8.
AI assistant
Which journals an AI assistant on this computer may read, what details it may see, and how to connect one. Covered in §17.
15. Licensing & Activation
Trial Period
When you install Tradelics for the first time, you can start a free trial with full access to all features. No credit card or account required — an email address is optional. Accepting the license agreement is part of the same screen, and starting the trial needs an internet connection (the app validates offline afterwards).
- Remaining trial days are shown in the license screen and the title bar.
- Your data is fully accessible throughout the trial and after activation — nothing is lost when you activate.
- If you don’t activate before the trial ends, Tradelics shows the activation screen on startup. Your journals remain safe; you just need to activate to continue using the app.
- The trial is one per device: reinstalling Tradelics does not grant a fresh trial. If you’ve already used yours, the app will tell you so.
Activating a License
- Purchase a license key from tradelics.com.
- Open the activation screen — it appears automatically on startup whenever the app isn’t yet licensed.
- Enter your license key in the input field.
- Click Activate. Tradelics connects to the license server to validate the key.
- On success, the app opens normally. Your key is now bound to this device.
Keep your license key in a safe place (password manager, email backup). You’ll need it if you transfer to a new computer.
Device Binding & Transfer
Each license key is bound to one device at a time. If you buy a new computer or reinstall Windows, you can transfer your license.
- Install Tradelics on the new computer.
- Enter your license key on the activation screen.
- If the key is already active on another device, Tradelics tells you so and asks whether you’d like to transfer it. Confirm, and a confirmation email is sent to your registered address.
- Open the email and click the confirmation link. The link is valid for 24 hours.
- Return to Tradelics — the confirmation dialog is still waiting — and click OK. Activation completes on the spot; you don’t need to enter your key again. (Clicked OK before the email? Just use Try Again once you’ve confirmed.)
Transferring moves the key to the new device — the old machine loses its activation as part of the process. Make sure you no longer need Tradelics on the old computer before confirming.
License States
| State | What it means |
|---|---|
| Licensed | Active license. Full access, no restrictions. |
| Trial Active | Free trial in progress. Full access. Days remaining shown in UI. |
| Trial Not Started | No trial has been used on this device — the license screen offers to start one. |
| Trial Expired | Trial period has ended. Activation screen shown on startup. Data is safe — activate to continue. |
| Read-Only | A licensed installation that has lost contact with the license service for an extended period (see below). Not shown for a revoked, suspended or refunded license, or an expired trial — those still go to the activation screen. |
Read-Only Mode
A licensed copy of Tradelics checks in with the license service from time to time, and normally does so silently in the background — you never see it. If it genuinely cannot reach the service (no internet, the service is down) it keeps working offline on trust for a while. Only if that offline period stretches past 30 days does anything change: rather than locking you out, Tradelics opens normally and switches to read-only.
What still works
- Opening and browsing journals
- Metrics, charts, calendar, filtering and all analysis views
- Exporting reports (PDF, Excel, CSV)
What’s paused
- Importing transactions
- Broker sync
- Adding, editing or deleting transactions, accounts, symbols or labels
Nothing is deleted and no data is at risk — a blocked action simply shows a notice explaining why instead of saving. Normal operation resumes automatically the moment Tradelics reaches the license service again; there is nothing to do on your end beyond reconnecting to the internet.
This is different from a rejected license (revoked, suspended, or a refunded purchase) or an expired trial — those still show the activation screen rather than opening read-only, since in those cases the service was reached and gave a definite answer.
16. Undo, Redo & Backups
Two separate safety nets, for two different kinds of mistake. Undo walks back the changes you made, one at a time, while the journal is open. Backups are whole copies of the journal on disk, and they are what you reach for when something larger went wrong — a bad import, a sync that brought in the wrong account, a file that will no longer open.
16.1 Undo & Redo
| Action | Shortcut |
|---|---|
| Edit → Undo | Ctrl+Z |
| Edit → Redo | Ctrl+Y or Ctrl+Shift+Z |
Tradelics records each change as it is written, so undo works across the whole journal rather than inside one text box. It covers what you did yourself:
- Edits made in Trade Details — including comments, review answers, image changes, and the values a status change gave up.
- Edits made in the Trades table, for one trade or many.
- Trades you added by hand, and trades you deleted.
- Accounts, symbols and labels — created, edited or deleted. Recolouring a label, correcting a tick size, or deleting an account you did not mean to are all one press of Ctrl+Z away, the same as a trade.
When something is put back, Tradelics jumps to the trade it changed and highlights the field it restored, so you can see what moved rather than having to go looking for it. A small notice in the bottom-left corner names what was Undone or Redone — the field and the trade, or “Changes to accounts” and the like — and carries a button that reverses it again, so a keystroke you did not mean is one click back. It dismisses itself.
A visit to a trade is undone field by field. Trade Details saves the whole trade in one write when you leave it, but if you set a stop loss and then a take profit, that was two edits — so it takes two presses of Ctrl+Z to take both back.
What undo deliberately does not touch
- Broker syncs. Ctrl+Z steps straight past them. Silently reversing a sync would take back trades the broker actually reported; a backup is the right tool for that (§16.3), and one is taken before every manual sync.
- Imports. Thousands of rows arrive at once, so an import is reversed by restoring the backup taken immediately before it — which is kept for exactly this reason, and is never rotated away by the backup timer.
Things you may run into
- Undo history does not cross sessions. It starts fresh each time a journal is opened, including a journal you have just restored from a backup. Ctrl+Z on a journal you opened a minute ago will not reverse last week’s edit.
- New work clears the redo stack. Once you change anything else there is nothing left to redo, and Tradelics says so rather than leaving the key looking broken.
- An unsaved edit is saved first. If the trade you are editing has a problem that stops it being saved, nothing is undone — fix the highlighted fields, then try again.
- Deleting an account discards its undo history. The confirmation counts how many of your own changes to that account would be given up, so you know what the delete costs before you agree to it.
- Some deletes cannot be undone, and say so first. A trade that came from a broker has its individual orders stored behind it, and those are removed with it in a way Ctrl+Z cannot reverse. The confirmation tells you before the delete rather than leaving you to discover it at the keystroke.
- Renaming is outside the undo history. Renaming an account, a label or a symbol rewrites every trade that used the old name, which is too much to hold as one undo step. The confirmation says so, and renaming it back is the way to reverse it.
- The journal is left alone while a dialog is open. Ctrl+Z behind a confirmation you have not answered yet would rewrite the very rows that dialog is about, so it is held back until you answer it.
- Read-only mode. Undo and redo are unavailable when Tradelics is running read-only (§15), along with every other write.
Ctrl+Y used to open the Symbols manager. It is now Redo, and the Symbols manager moved to Ctrl+Shift+Y.
Inside an editing dialog
While you are typing in a field — an account’s opening balance, a symbol’s tick size, a trade’s comment — Ctrl+Z is that field’s own undo, and it takes back what you typed in one press even after the field has reformatted itself on the way out. Nothing has reached the journal yet, so there is nothing else for it to reverse. Once the dialog is saved, the same keystroke goes back to walking the journal.
The Accounts, Symbols and Labels windows answer the undo keys themselves, so you do not have to return to the main window to take a change back.
16.2 Automatic Backups
Tradelics keeps its own copies of the open journal in a backups folder beside it, and takes them without being asked. The settings live in Preferences → System (§14).
A backup is taken:
- On a timer — every 30 minutes by default, or every 15 minutes, hour, or 4 hours. A tick is skipped when nothing has changed since the last copy, so an app left open overnight does not fill the folder with identical files.
- When Tradelics closes, unless you turn that off.
- Before every manual sync, so a sync can be rolled back.
- Before every import, so an import can be rolled back. These are kept separately from the timed ones, so a frequent timer can never rotate away the copy you are about to need.
- Whenever you press Back up now in Preferences.
Each file’s name records what caused it, which is what the restore list shows you. Timed and on-closing copies rotate against the Automatic backups to keep budget (10 by default); pre-import and manual copies have budgets of their own.
Backups cover your trades and settings — not your images. Screenshots live in the journal’s images folder and are left where they are, which also means restoring a backup never deletes them. For a complete copy of everything, use File → Save Journal As… (Ctrl+Shift+S), or copy the whole journal folder.
16.3 Restoring from a Backup
- Open File → Restore from Backup…
- Pick a copy from the list. Each row shows when it was taken and what caused it — Automatic, On closing, Manual, Before sync or Before import.
- Click Restore and confirm.
Everything recorded after the copy you choose — syncs, imports and edits — is lost, and a restore cannot itself be undone. If you are unsure, press Back up now first: that gives you a copy of the current state to come back to.
A restore cannot run while a sync is in progress; Tradelics asks you to wait for it to finish. Journals that already had snapshots from an earlier version keep them — they appear in the same list, and are never rotated away.
17. AI Assistant
Tradelics can answer questions from an AI assistant you already use on this computer — Claude Desktop, Codex, OpenClaw or any other app that supports MCP (Model Context Protocol). Ask in plain language — “What’s my win rate on EURUSD shorts since July?”, “Which tags lose me money?”, “Why was last month a losing month?”, “Read my notes on the trades where I moved my stop” — and the assistant asks Tradelics for the figures.
How it treats your data
- Read-only. An assistant can never change, add or delete anything in your journals.
- Figures come from Tradelics. Win rate, P/L, drawdown, R and every other number are calculated by Tradelics exactly as on the Dashboard, then handed over — the assistant doesn’t do the arithmetic. Multi-currency journals are reported in your base currency.
- Only what you allow. Off by default. You choose which journals are shared and whether account numbers and notes are included.
- Nothing goes through Tradelics’ servers. The assistant talks to Tradelics on your own computer. Your AI app sends your questions and the answers to its own provider under its own terms, as it does with anything else you ask it.
- No extra cost. It uses the AI subscription you already have; Tradelics charges nothing for it.
Setting it up
- Open Preferences → AI assistant and switch on Allow AI assistants.
- Under Journals, tick the journals an assistant may read. Your recent journals are listed; use Add journal… for any other.
- Under What is shared, decide on Account numbers and broker IDs (off: accounts are named by their display name only) and Notes and review answers (off: notes are never read and note search isn’t offered).
- Connect your assistant:
- Claude Desktop — click Install in Claude Desktop. Tradelics puts
Tradelics.mcpbin your Downloads folder and shows it; in Claude Desktop open Settings → Extensions → Advanced settings → Install Extension…, choose the file and confirm. - Other apps — pick the format (Claude Desktop and most apps, Codex or OpenClaw), click Copy configuration, and paste it into the app’s MCP server settings as the hint describes. Then restart the app.
- Claude Desktop — click Install in Claude Desktop. Tradelics puts
- Click Test connection to check: it reports how many of your shared journals the assistant can read.
Changes on this page apply to the assistant’s next question — there’s no need to restart it. Switching Allow AI assistants off stops all data at once; a connected assistant then only gets a note on how to switch it back on.
Tradelics does not need to be running for the assistant to answer. It reads the shared journals directly, without touching them. It works while Tradelics is licensed, during a trial and in read-only mode; without a licence or trial it answers that one is needed.
Claude Desktop is the officially supported app. Other MCP apps should work with the copied configuration, but are not tested or supported. After Tradelics updates, Claude Desktop keeps using the previous version until you switch the Tradelics extension off and on again under Settings → Extensions (or quit Claude from its tray icon and start it again).
What you can ask
The assistant can list your journals and accounts, get summaries and breakdowns (by symbol, direction, strategy, signal, confirmation, tag, account, weekday, hour, day, week or month), the equity curve and drawdown, insights, find trades with the same conditions as the Filter view, read a single trade in full, and — if you allow notes — search your notes. Ready-made prompts are included for a weekly review, a losing month, a rule audit, comparing two periods, a trade review and the themes in your notes; in Claude Desktop they appear in the prompt menu.
Trade links
When the assistant mentions a trade, it refers to it by its Trade # and can give you a link (tradelics://trade/…), or open the trade for you. Clicking it opens that trade in Tradelics — starting Tradelics and opening the right journal if needed. A link only ever opens a journal you have shared with AI assistants.
18. Keyboard Shortcuts
| Category | Shortcut | Action |
|---|---|---|
| File | ||
| Ctrl+N | New journal | |
| Ctrl+O | Open journal | |
| Ctrl+W | Close journal | |
| Ctrl+Shift+S | Save journal as (backup copy) | |
| Ctrl+S | Sync accounts | |
| Ctrl+I | Import transactions | |
| Ctrl+, | Open Preferences | |
| Ctrl+Shift+R | Repair journal | |
| Ctrl+Q | Exit application | |
| Edit | ||
| Ctrl+Z | Undo your last change (§16.1) | |
| Ctrl+Y / Ctrl+Shift+Z | Redo | |
| Ctrl++ | Add transaction | |
| Ctrl+− | Delete transaction | |
| Delete / Backspace | Delete selected rows (Trades) | |
| View | ||
| Ctrl+A | Accounts manager | |
| Ctrl+L | Labels manager | |
| Ctrl+Shift+Y | Symbols / Pairs manager | |
| Ctrl+1 | Calendar View | |
| Ctrl+2 | Trades | |
| Ctrl+3 | Trade Details | |
| Ctrl+4 | Metrics & Statistics | |
| Ctrl+5 | Report View | |
| Ctrl+6 | Filter | |
| Trade Details Navigation | ||
| Ctrl+← | Previous trade | |
| Ctrl+→ | Next trade | |
Number-based shortcuts also work with the numeric keypad — Ctrl+NumPad 1–6 and NumPad + / − behave the same as their main-keyboard counterparts.
19. Troubleshooting
Sync Issues
Sync fails or shows “Bridge not reachable”
- Try restarting Tradelics — the bridge starts with the app.
- Confirm that MT5 is open and logged in on the same computer. The bridge connects to the platform locally.
- Check that your firewall or antivirus is not blocking the bridge process.
The first MT5 sync after installing or updating is slow
- The connection service Tradelics uses for MetaTrader 5 takes longer to start the first time after an install or update — sometimes a minute or two. The sync dialog says so (Still starting the connection service…) and waits instead of failing. Later syncs start quickly.
- On a long first sync, MetaTrader may also be downloading price history. If it goes quiet, Tradelics tells you (MetaTrader is taking longer than usual) — wait, or press Cancel and sync again later.
“MetaTrader 5 is not currently running”
- Open the installation this account uses and wait for it to connect to your broker, then sync again.
- To have Tradelics open it for you, tick Start MetaTrader 5 when syncing under Sync schedule in the account’s settings. It is a per-account setting — there is no application-wide one — so it launches that account’s own installation (see §4.2).
Sync stops with “open this account in MetaTrader 5”
- The installation is signed in to a different account than this connection is for. Because the connection reads the open session, it holds no password and cannot switch by itself.
- Either sign that installation in to the right account, or — if two accounts genuinely share one installation — set the connection up with credentials so Tradelics can sign in (see §4.2).
Broker credentials suddenly need re-entering
- Stored broker credentials are encrypted with a key kept in your operating system’s secure storage. After an OS reinstall (or a lost Windows profile), that key is gone and the stored credentials can’t be decrypted — Tradelics will simply ask you to enter them again. Your trade data is unaffected.
- MT5 connections that read the open session store no password, so they are never affected by this.
Sync succeeds but no new trades appear
- Check the active filter — a date or account filter may be hiding the new trades.
- Confirm the synced account in Tradelics matches your broker account login. If you have multiple MT5 accounts, make sure the right one is configured.
- Some brokers only report closed trades; open positions appear after they close.
Trades arrive at the wrong time of day
- Set Server time zone on the account — it is in the Account Details section of the Account Dialog, next to the currency, not in the Broker Connection section (see §3.3).
- If every account is out by the same amount, change the default instead: Preferences → Sync/Import → Server time zone.
- A whole-hour error that appears only in summer or only in winter means the zone is wrong rather than the times: pick the broker’s actual zone and Tradelics follows its daylight-saving dates for you.
- Then re-import or re-sync the affected trades. The zone is applied when a trade arrives, not when it is displayed, so fixing the setting corrects future imports only — the trades already stored keep the times they were given. To re-fetch a synced period, set Last Sync Time back to before it (see §4.7).
Kraken API error
- Verify the API key has Query Funds and Query Closed Orders & Trades permissions enabled on Kraken (see §4.5).
- Check that the key has not been revoked or expired in your Kraken account settings.
- Ensure your internet connection is active and tradelics.com / api.kraken.com are reachable.
Import Issues
CSV import: “Format not recognized”
- Verify the file came from a supported broker export (§7.2).
- Open the CSV in a text editor and check the first row — does it contain the expected column names?
- Try creating a Custom CSV Mapping (§7.3) to manually specify the column layout.
CSV import: Numbers or dates import incorrectly
- Go to Preferences → Regional Settings and make sure the Number Format matches your CSV’s decimal separator (dot vs. comma).
- If using a Custom Mapping, set the Date Format field to match the format in your CSV (e.g.,
dd/MM/yyyy HH:mm:ss).
Trades imported but balance looks wrong
- Verify the Initial Balance in Account Settings is correct — this is the starting point for balance calculation.
- Check for missing deposits or withdrawals in the import.
- Run File → Repair… (Ctrl+Shift+R) — a repair always recalculates all balances from scratch.
Performance & Stability
Application is slow with a large trade history
- Use Filters to work with a subset of trades (e.g., current year only). Metrics and the Trades view will be much faster on filtered data.
- If you have been working across several journals, close and reopen the one you’re working with.
Application crashes or behaves unexpectedly
- Check the log files. Press Ctrl+Shift+L to open the logs folder directly — the
app.logfile contains a detailed record of what happened. (This shortcut isn’t on any menu since most people never need it; if you’d rather browse there yourself, logs live at%APPDATA%\Tradelics\logson Windows,~/Library/Application Support/Tradelics/logson macOS, and~/.config/Tradelics/logson Linux.) - Try File → Repair… (Ctrl+Shift+R) to check for and fix any data integrity issues.
- If the trade database itself seems damaged, File → Restore from Backup… lets you roll the journal back to an earlier copy — see §16.3.
- Still stuck? Help → Contact Support (or tradelics.com/contact-support) and attach the log file.
Licensing Issues
“This license key looks mistyped”
- Tradelics checks the shape of your key before it contacts the license server, so an obvious typo is caught straight away rather than after a round trip. Compare it against the key in your purchase email — a single wrong or missing character is enough.
- The check is a convenience, not a verdict. If you are confident the key is right, click Activate a second time with the same key and Tradelics submits it anyway; the license server has the final say.
“No connection”, “Secure connection failed” or “The license server did not respond”
- The license screen now says why it could not reach the license server (tradelics.com), with the technical details underneath.
- No connection — check your internet connection. If your browser works, your network or security software may be blocking tradelics.com.
- Secure connection failed — something is intercepting the connection: usually antivirus software that scans HTTPS traffic, a company network filter, or a Wi-Fi login page. Allow Tradelics in your security software, or try another network.
- Did not respond — a firewall, proxy or security software may be blocking Tradelics. Allow it through, or try another network.
- Tradelics trusts the same certificates as Windows and uses your Windows proxy setting, so if websites open in your browser, Tradelics should normally get through too.
Activation fails with “Key not found” or “Invalid key”
- Double-check that you copied the key exactly — no leading/trailing spaces, and all characters included.
- Verify the key was purchased for Tradelics (not another product).
- Ensure your internet connection is active — activation requires a connection to the license server.
Activation fails with “License Already Active” on another device
- Tradelics automatically offers a device transfer when it sees the key is registered elsewhere — confirm the dialog to start it.
- Check your email for the transfer confirmation link (valid 24 hours) and click it.
- Return to the waiting dialog in Tradelics and click OK — activation completes without re-entering the key. See §15.
Trial ended earlier than expected, or won’t start
- The trial is one per device — a previously used trial doesn’t reset on reinstall, so “Your free trial has already been used” after a reinstall is expected behavior.
- Starting a trial requires an internet connection; once started, it validates offline.
- If you believe something went wrong with your trial, contact support at tradelics.com with your details.
Tradelics — Professional Trading Journal & Analytics
www.tradelics.com